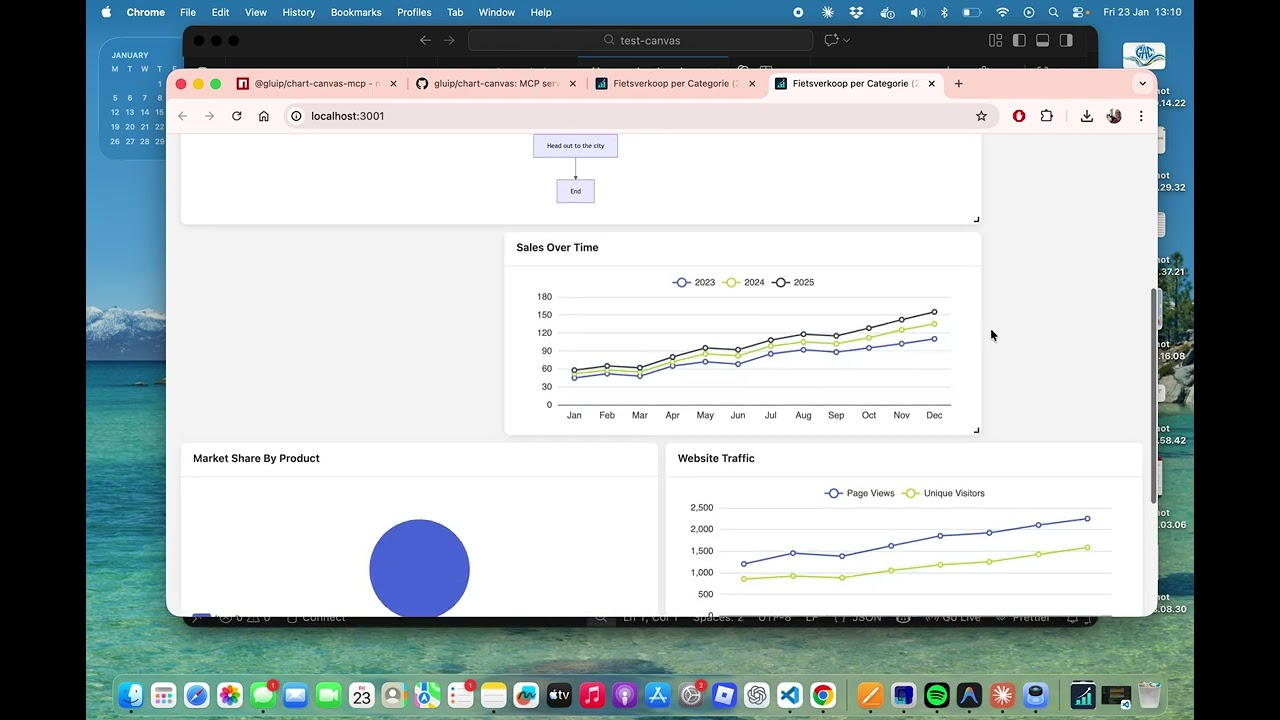
Interactive visualization dashboard for AI assistants via Model Context Protocol
Create beautiful charts, diagrams, and tables directly from your AI conversations. Chart Canvas provides a real-time dashboard that displays visualizations as you work with LLMs like Claude.
Demo
Create interactive visualizations and query data sources (SQLite, CSV, Parquet, JSON)
✨ Multiple Chart Types: Line, bar, scatter, pie charts, tables, and Mermaid diagrams
🎨 Interactive Dashboard: Drag-and-drop grid layout with real-time updates
🔄 Live Synchronization: Changes appear instantly in your browser
📊 Rich Visualizations: Powered by ECharts and Mermaid
💾 Universal Data Sources: Query SQLite, CSV, Parquet, JSON, and NDJSON files directly
⚡ Smart Data Flow: Execute queries server-side - data stays local, never sent to LLM
🔒 Privacy First: Your data never leaves your machine
🚀 Easy Setup: One command to get started
🌐 Production Ready: Built-in production mode with optimized builds
Supported Data Sources
Chart Canvas can query and visualize data from multiple file formats:
Privacy & Performance: All queries execute locally on your machine using DuckDB. Query results are transformed into visualizations server-side - only metadata (chart configuration) is sent to the LLM, never your actual data. This makes it fast, scalable, and private.
Quick Start
Installation
npm install -g @gluip/chart-canvas-mcp
Or use directly with npx (no installation needed):
npx @gluip/chart-canvas-mcp
Configuration
Add to your MCP client configuration (e.g., Claude Desktop):
Use the showCanvas tool to open the dashboard in your browser
Ask the AI to create visualizations!
Example Prompts
"Show me a line chart comparing sales data for 2023 and 2024"

"Create a pie chart showing market share by region"

"Draw a flowchart for the user authentication process"

"Make a table with team member information"

"Show me the database schema for my SQLite database"

"Query the athletes table and show the top 10 with most personal records"

"Create a chart showing sales trends from the database grouped by region"
MCP Tools
addVisualization
Create charts, diagrams, and tables on the canvas.
Inspect the structure of a SQLite database to understand available tables and columns before writing queries.
Parameters:
databasePath - Path to SQLite database file (e.g., ./data/mydb.sqlite or absolute path)
Example:
{
  databasePath: "/path/to/database.db";
}
Returns: Formatted schema showing all tables, columns, data types, and constraints.
queryAndVisualize
Execute a SQL query on a SQLite database and create a visualization from the results. Queries are executed server-side and must be read-only (SELECT only). Maximum 10,000 rows.
Parameters:
databasePath - Path to SQLite database file
query - SQL SELECT query (read-only)
visualizationType - Type of chart: line, bar, scatter, pie, or table
columnMapping (optional for table) - Mapping of columns to chart axes:
xColumn - Column for X-axis (required for charts)
yColumns - Array of columns for Y-axis (required for charts)
seriesColumn - Column to group data into separate series (optional)
groupByColumn - Alternative grouping column (optional)
title - Optional title for visualization
description - Optional description
useColumnAsXLabel - If true, use X column values as labels instead of numbers
Example:
{
  databasePath: "./data/sales.db",
  query: "SELECT region, SUM(revenue) as total FROM sales GROUP BY region",
  visualizationType: "bar",
  columnMapping: {
    xColumn: "region",
    yColumns: ["total"]
  },
  title: "Revenue by Region",
  useColumnAsXLabel: true
}
Security: Only SELECT and WITH (CTE) queries are allowed. INSERT, UPDATE, DELETE, DROP, and other modifying operations are blocked.
Architecture
Backend: Node.js + TypeScript + Express + MCP SDK
Frontend: Vue 3 + ECharts + Mermaid + Grid Layout
Communication: Real-time polling for instant updates
Development
Local Development
# Clone repository
git clone https://github.com/gluip/chart-canvas.git
cd chart-canvas

# Install backend dependencies
cd backend
npm install

# Install frontend dependencies
cd ../frontend
npm install

# Development mode (backend + frontend separate)
# Terminal 1 - Backend
cd backend
npm run dev

# Terminal 2 - Frontend
cd frontend
npm run dev

# Production mode (single server)
cd backend
npm run build:all
npm run start:prod
Aún no hay lista de herramientas. Los servidores remotos la reciben tras la primera comprobación de estado.
Preguntas frecuentes
Preguntas
¿Cómo instalo Chart Canvas?
Copia en esta página la configuración stdio para Cursor, Claude Desktop, Claude Code o VS Code. Usa la instalación del publicador, no un proxy de PlugMCP.
¿Chart Canvas necesita una clave de API?
Este registro no indica ninguna variable de entorno obligatoria.
¿Qué transporte usa Chart Canvas?
Chart Canvas se ejecuta localmente por stdio.
¿Cuándo se comprobó Chart Canvas por última vez?
Última comprobación: 2026-11-09. Create interactive visualizations and query data sources (SQLite, CSV, Parquet, JSON)