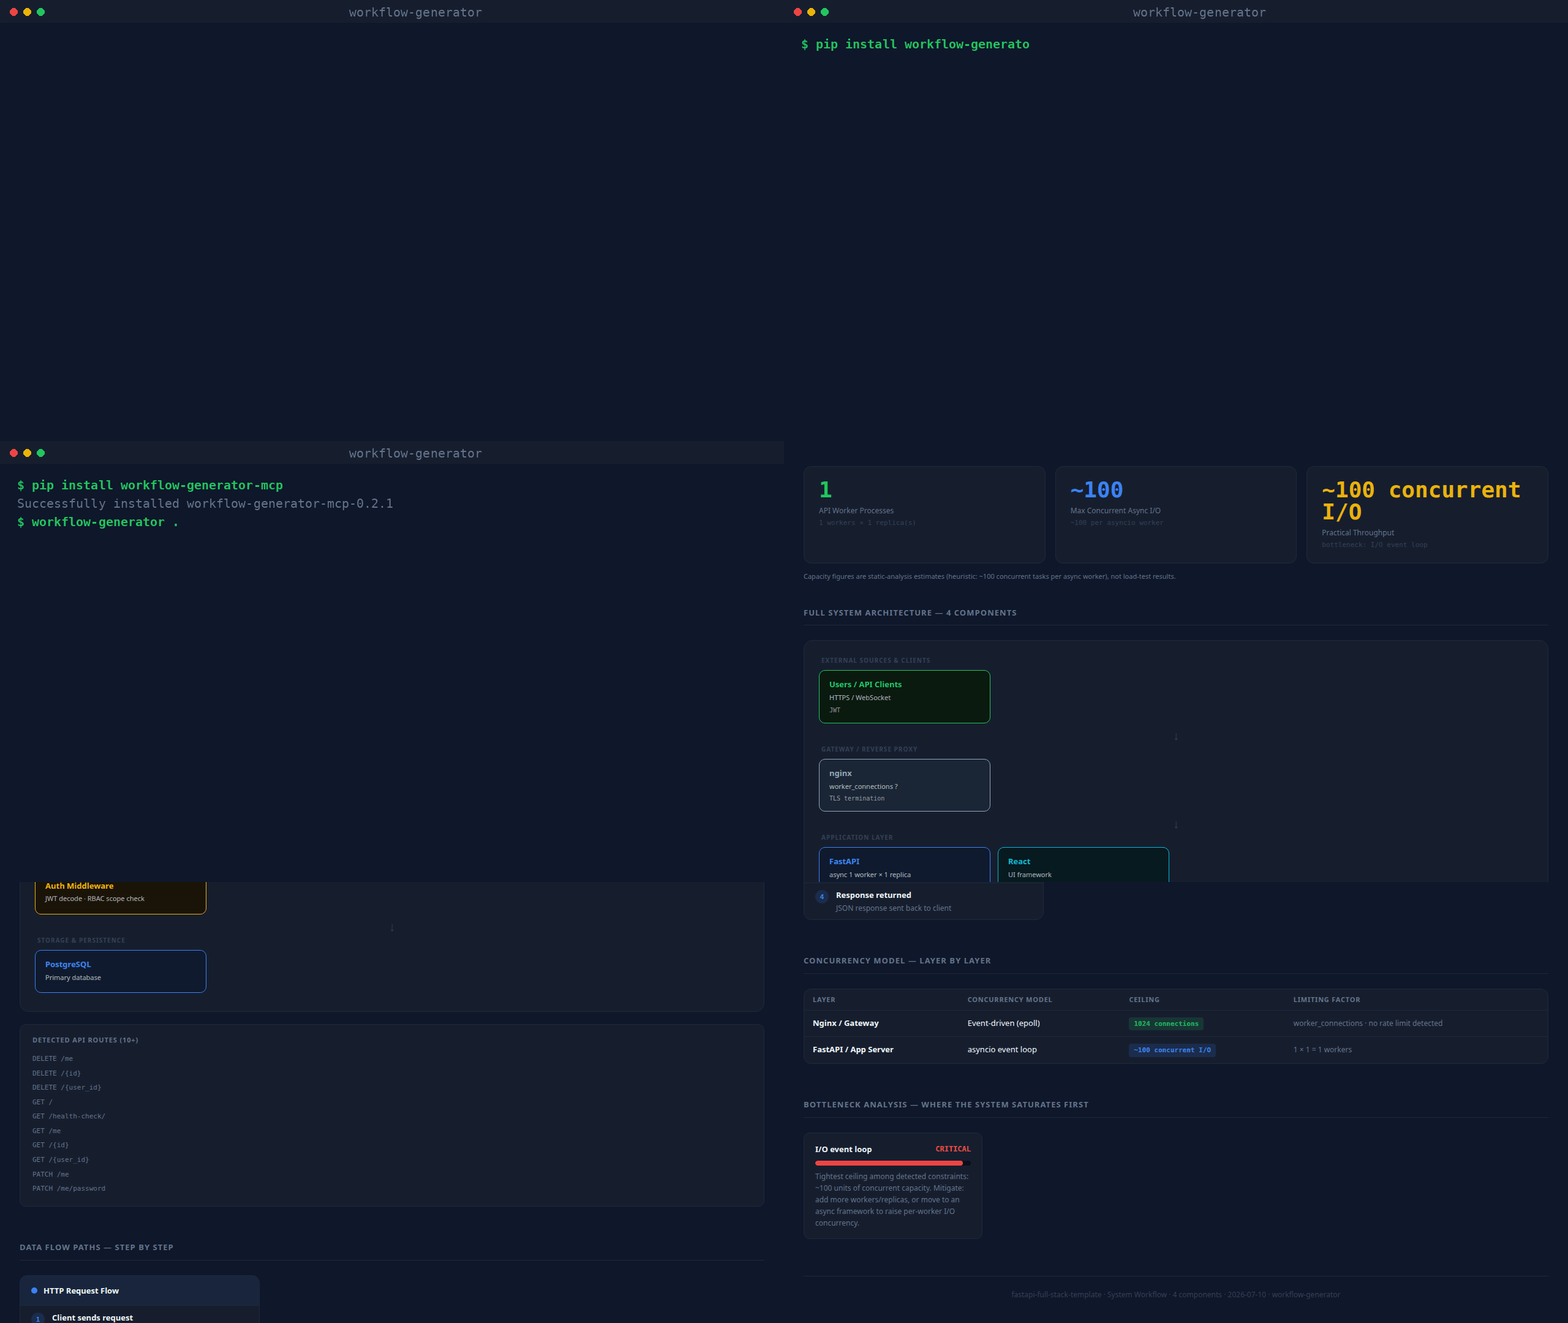
Scan any project and generate WORKFLOW.html — a dark-mode visual system diagram showing every component, how they talk to each other, and where your throughput ceiling actually is.
Works with Python, Node.js, Go, Java, Rust, Ruby, and mixed projects. No external dependencies for the core scanner.
Vendored and generated directories (node_modules, venv, , , …) are never scanned,
and capacity figures are clearly labeled as static-analysis estimates.
Architecture diagram with concurrency capacity and bottleneck estimates from any codebase.
Layered flow: external sources → gateway → API → queues → AI → storage
Data flow cards
Write path, read/query path, background jobs — inferred from what's detected
Concurrency table
Every layer: model · ceiling · limiting factor
Bottleneck analysis
Ranked CRITICAL → LOW with mitigation notes
Codebase dependency graph
Force-directed module/import graph — click a node to isolate its neighbors, hover for file details. Import-direction edges are clearly distinguished from real observed traffic (see below)
Guided tour
Spotlight walkthrough of every section, shown automatically the first time a report is opened; replay anytime with the ? button
Codebase dependency graph
Every source file (Python, JS/TS, Go, Java, Rust, Ruby) becomes a node; every real import becomes
an edge — resolved with a language-appropriate parser (Python's ast module, regex for JS/TS/Go/
Java/Rust/Ruby), not guessed. Files that match an already-detected component (an LLM call, a
database client, a queue) get an edge to that component too, so you can see exactly which files
talk to Redis, OpenAI, etc. Large repos (350+ files) are automatically aggregated into
directory-level nodes so the graph stays readable; override with --graph-detail files or
--graph-detail dirs.
By default the graph only shows what the code says (import direction, static "this file calls
Redis"), which is honest but not the same as real traffic. Pass --access-log /path/to/access.log
(any combined/common log format) to overlay real observed request counts onto the HTTP-entry
edges — and the generated report includes a ready-to-run k6 load-test script
covering up to 5 detected routes, so the "Practical throughput" number can be checked against a
real measurement instead of only a static-analysis estimate.