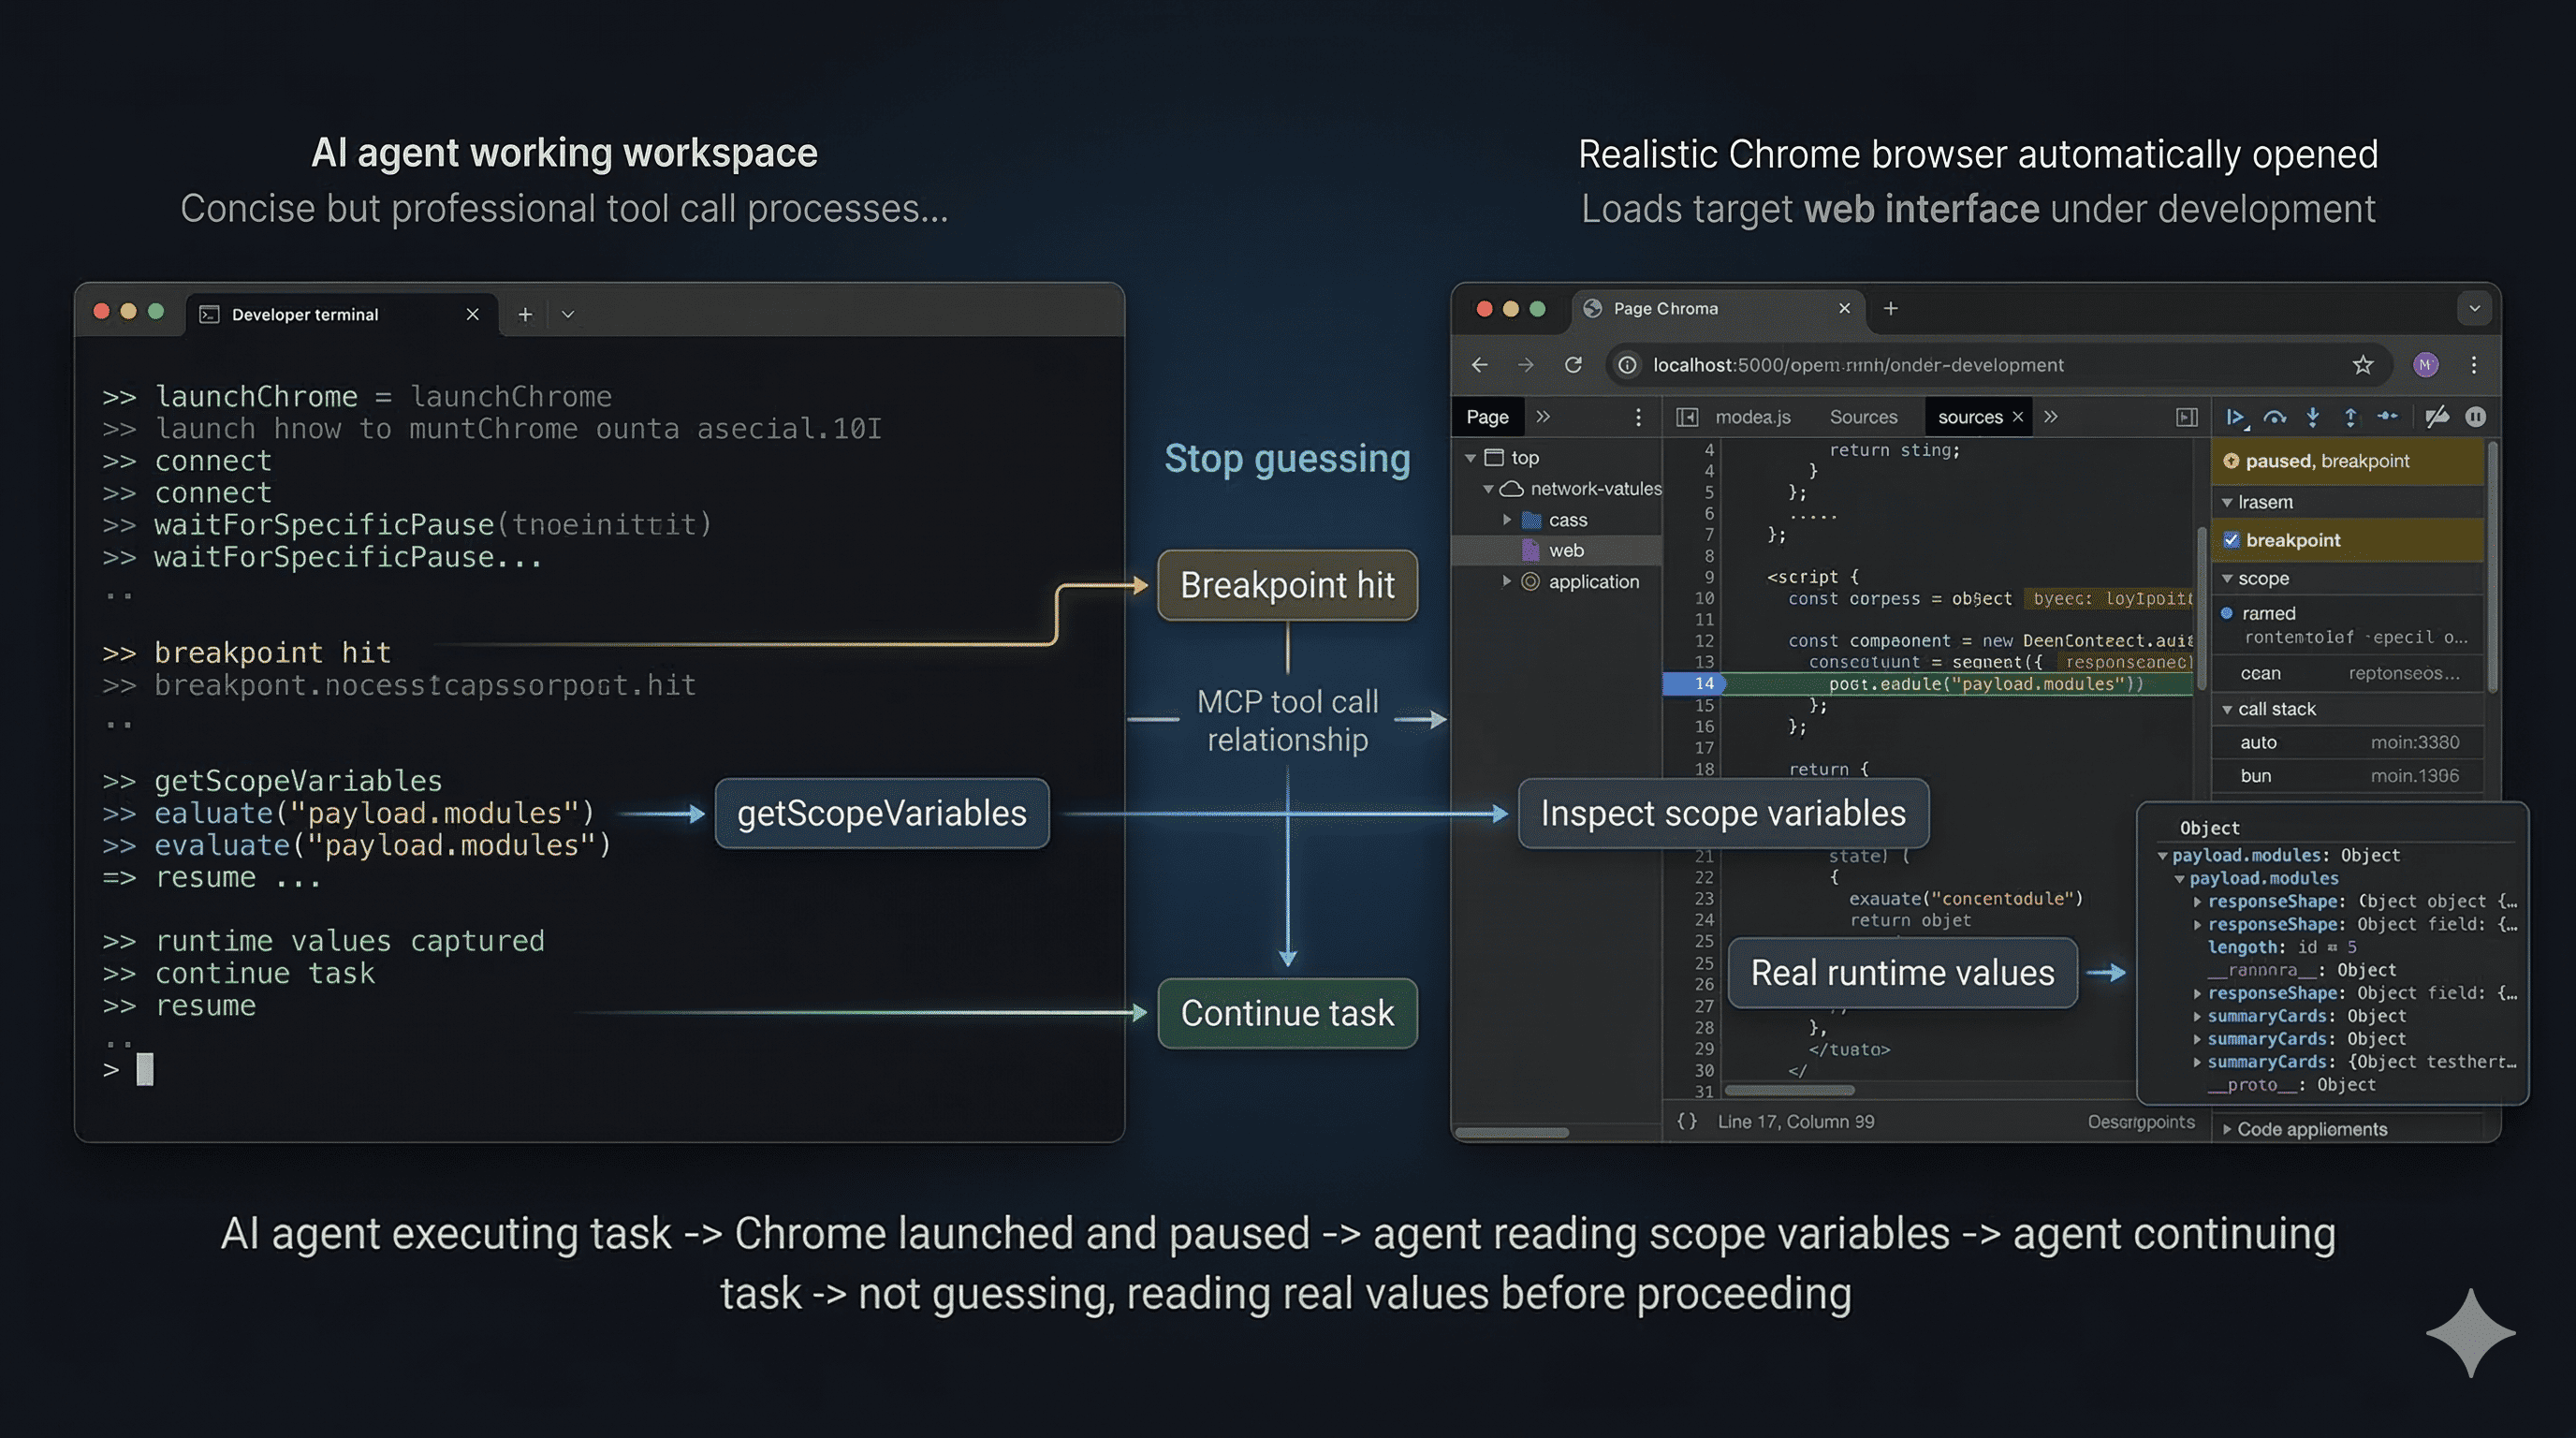
An MCP server for breakpoint-driven Chrome debugging.
chrome-debugger-mcp exposes Chrome DevTools Protocol primitives as MCP tools so an AI agent can attach to a real Chrome tab, pause execution, inspect scope values, evaluate expressions inside the current call frame, and step through code with runtime facts instead of guessing from static source.
Chrome breakpoint debugging MCP server for inspecting runtime values and stepping through code
2026-11-08
스타
—
도구
—
가동 시간
—
It is not a general browser automation server. The focus is runtime debugging.
Core Capabilities
Attach to a real Chrome tab over CDP after explicit user confirmation
Pause at breakpoints or debugger; statements and wait for the exact pause you expect
Read local, closure, and module scope values from the paused frame
Evaluate JavaScript in the current call frame and step execution forward
Resume cleanly so the agent can continue with actual runtime values
Demo
Demo: the agent launches Chrome, waits for a breakpoint, inspects real scope variables, and resumes with runtime facts instead of guessing.
Launch a dedicated Chrome instance with remote debugging enabled
Set and remove DevTools breakpoints without editing source code
Reload the page through CDP so breakpoints reliably bind after navigation
Poll debugger state when the MCP client has short request timeouts
Emit _ui payloads and logging messages that clients can surface to the user
Why It Helps
Many browser-focused MCP tools are strong at DOM interaction and network inspection, but weak at runtime debugging. This server gives an MCP client the missing loop you would normally use in Chrome DevTools: attach to the right tab, pause at the right time, inspect real values, step if needed, and resume cleanly.
It also adds guardrails that prevent common agent mistakes:
guessing which tab to attach to
concluding behavior without inspecting runtime values
ending the turn between reloadPage() and waitForSpecificPause()
Requirements
Google Chrome installed locally
An MCP client that supports stdio servers and tool calling
Access to the application you want to debug
Local source access if you plan to insert temporary debugger; statements
Tooling Model
The server runs over stdio and exposes MCP tools. The most important tools are:
startDebuggingSession: returns the recommended debugging workflow and critical rules for agent behavior
launchChrome: launches a dedicated Chrome instance with remote debugging enabled
listTargets: lists available Chrome tabs and requires the user to pick one
connect: attaches to the confirmed tab
setBreakpoint: creates a CDP breakpoint without modifying source files
removeBreakpoint: removes a breakpoint created by setBreakpoint
reloadPage: reloads the current page through CDP
waitForSpecificPause: waits for the next pause and checks whether it matches a target file and line
waitForPause: waits for any pause without location matching
getScopeVariables: reads local, closure, and module scope values from the paused frame
evaluate: executes JavaScript in the paused call frame
stepInto, stepOver, stepOut: standard execution control
resume: resumes execution after inspection
getStatus: non-blocking polling for connected or paused state
forcePause: requests a pause at the next JavaScript statement
Recommended Workflow
For AI clients, the intended flow is:
Call startDebuggingSession().
Call launchChrome() or use an already-running Chrome instance with a CDP port.
Call listTargets() and show the full tab list to the user.
Wait for the user to confirm the exact page URL.
Call connect({ targetUrl }).
Insert a temporary debugger; statement in local source code, or call setBreakpoint().
Call reloadPage().
Immediately call waitForSpecificPause() in the same turn.
Call getScopeVariables() and evaluate() to inspect runtime values.
Step if necessary with stepInto(), stepOver(), or stepOut().
Call resume().
Remove any temporary debugger; statements from source code.
Important Rules For Agent Authors
This server is designed for tool-using agents, not only for humans. If you are integrating it into an MCP client, keep these rules:
Never skip listTargets().
Never guess the target URL, even if only one tab is open.
Always wait for explicit user confirmation before connect().
After reloadPage(), immediately call waitForSpecificPause() or waitForPause() in the same turn.
Do not explain behavior from static code when runtime values can be inspected directly.
Always resume() after inspection.
If you added temporary debugger; statements to source code, remove them before finishing.
How waitForSpecificPause Matches
waitForSpecificPause is the preferred waiting primitive because it is more reliable than waiting for an arbitrary pause.
It matches a pause using two strategies:
URL fragment plus line tolerance
URL fragment plus debugger-statement pause reason
The second path matters when source maps, transpilation, or bundling shift compiled line numbers away from editor line numbers.
Example Tool Sequence
An agent debugging a local Vite app might do something like this:
launchChrome({ dryRun: true })
launchChrome()
listTargets()
Wait for the user to confirm http://127.0.0.1:5173
If automatic launch fails, the tool returns a command the user can run manually.
Local Playground
This repository includes a disposable test app under test/ so you can exercise the debugger server against a realistic browser workflow.
Start the mock service
cd test/service
node src/server.js
The service listens on http://127.0.0.1:3030.
Start the web app
cd test/web
pnpm install
pnpm dev
The web app runs on http://127.0.0.1:5173.
Useful places to pause:
test/web/src/App.jsx inside loadWorkbench
test/web/src/App.jsx inside loadModuleDetail
test/web/src/App.jsx around the unfinished detail sections
Runtime payload areas worth inspecting:
summaryCards
modules
apiContracts
nextActions
responseShape
Troubleshooting
No targets found
Make sure Chrome is running with --remote-debugging-port=9222 and the target page is open.
More than one tab matches targetUrl
Pass a more specific substring so the match becomes unique.
waitForPause or waitForSpecificPause times out
This can happen when:
the page action was never triggered
the wrong breakpoint was set
the MCP client itself has a shorter request timeout than the tool call
If your client times out quickly, use getStatus() to poll or increase the client timeout.
The paused line number does not match the editor line
Bundlers and transpilers can shift compiled line numbers. Use waitForSpecificPause() and rely on URL fragment matching plus debugger-statement semantics.
Chrome does not launch automatically
The machine may use a non-default Chrome install path. Run the returned launch command manually or adjust the implementation to match your environment.
Development
pnpm install
pnpm build
node dist/index.js
The implementation lives in:
src/index.ts: MCP tool definitions and user-facing workflow hints
src/chrome-manager.ts: Chrome DevTools Protocol integration and debugger state management