JDB-MCP: Java Debugger MCP Server
JDB-MCP is a Model Context Protocol (MCP) server based on the Java Debug Interface (JDI). It enables AI agents (such as Claude, Cline, Trae) to perform deep runtime debugging of Java applications.
Power your agent
การติดตั้งจากผู้เผยแพร่ ไม่ใช่เอนด์พอยต์ของ PlugMCP
URL แบบรีโมตหรือคำสั่งบนเครื่องของคุณ? การติดตั้งสองแบบต่างกันอย่างไร
รันบน PlugMCP
A new server you create. It is not this listing's official endpoint. Use the publisher install when you want their URL and their credentials.
เปิดจากผู้เผยแพร่
JDB-MCP is a Model Context Protocol (MCP) server based on the Java Debug Interface (JDI). It enables AI agents (such as Claude, Cline, Trae) to perform deep runtime debugging of Java applications.
Java Debugger MCP Server. Enables AI agents to debug live Java apps via JDI with breakpoints, stack tracing, and variable inspection.
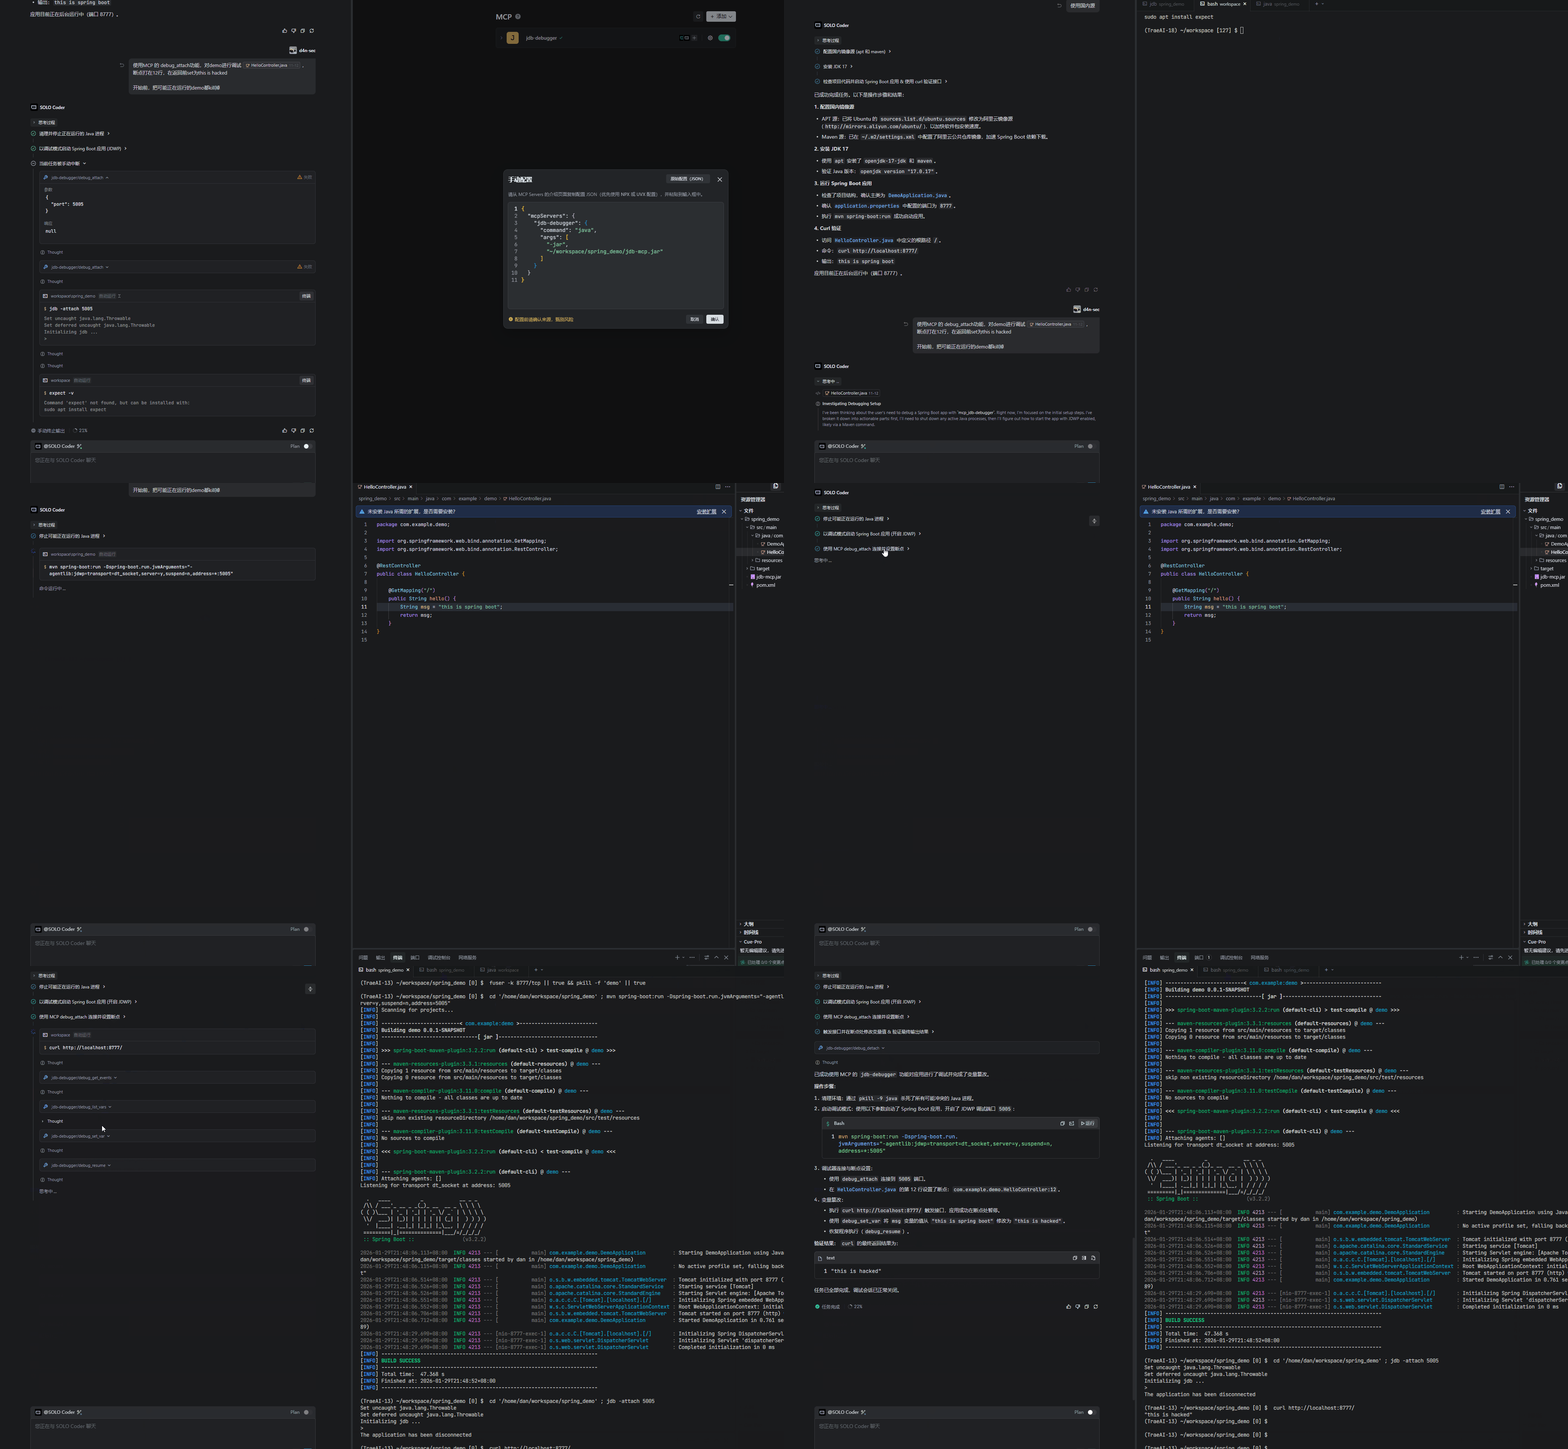
stdio (standard VSCode integration) and http (for remote/curl debugging).debug_attach) - Supports any Java application (SpringBoot, Maven, Gradle, etc.) with JDWP enabled.debug_set_breakpoint, debug_set_watchpoint)debug_list_threads, debug_list_classes)sessionId management.# Build all modules and generate JARs in the `release/` directory
mvn clean package
# Or build for a specific JDK version:
# For JDK 17+ (Recommended)
mvn clean package -pl jdb-mcp-jdk17 -am
# For JDK 7 (Legacy Support)
mvn clean package -pl jdb-mcp-jdk7 -am
The executable JARs will be located in the release/ directory:
release/jdb-mcp.jar (JDK 17+)release/jdb-mcp-jdk7.jar (JDK 7)--transport <stdio|http>: Set transport mode (default: stdio).--notifications <true|false>: Enable real-time AI notifications (default: true).For detailed tool parameter analysis, please refer to the Parameter Guide.
Add the following configuration to your MCP settings:
{
  "mcpServers": {
    "jdb-debugger": {
      "command": "java",
      "args": [
        "-jar",
        "path/to/jdb-mcp.jar"
      ]
    }
  }
}
Important: You must manually start your target Java application with JDWP enabled.
java -agentlib:jdwp=transport=dt_socket,server=y,suspend=n,address=*:5005 -jar your-app.jar
Attach to localhost:5005 and debug...debug_attach: Attach to an existing debug port via Socket.debug_list_threads: List all threads and their status.debug_list_classes: List loaded classes with optional filtering.debug_list_methods: List methods in a specific class.debug_source: Retrieve source code for a class (requires source roots).debug_set_method_breakpoint: Set a breakpoint at method entry.debug_set_method_entry: Monitor method entry events.debug_set_method_exit: Monitor method exit events.debug_list_vars: List variables (supports threadName, frameIndex and scope filter).debug_get_var: Get detailed info for a specific variable.debug_set_var: Modify runtime variables (supports threadName and frameIndex).tools/list).debug_launch: Enable "out-of-the-box" experience by allowing users to launch and debug Java programs directly through the MCP.debug_calc: Support evaluating arbitrary Java expressions in the debug context (Expression Evaluation).com.example.*) for method entry/exit and breakpoints.Open-sourced under the MIT License.
Java Debugger MCP Server. Enables AI agents to debug live Java apps via JDI with breakpoints, stack tracing, and variable inspection.
เครื่องมือ
ยังไม่มีรายการเครื่องมือ เซิร์ฟเวอร์แบบรีโมตจะได้รายการหลังการตรวจสอบสถานะครั้งแรก
FAQ
คัดลอกคอนฟิก stdio สำหรับ Cursor, Claude Desktop, Claude Code หรือ VS Code ได้ในหน้านี้ คอนฟิกนี้ใช้การติดตั้งของผู้เผยแพร่ ไม่ใช่พร็อกซีของ PlugMCP
ระเบียนนี้ไม่ได้ระบุตัวแปรสภาพแวดล้อมที่จำเป็น
Jdb ทำงานแบบโลคัลผ่าน stdio
ตรวจสอบล่าสุดเมื่อ 2026-10-27 Java Debugger MCP Server. Enables AI agents to debug live Java apps via JDI with breakpoints, stack tracing, and variable inspection.
