Power your agent
การติดตั้งจากผู้เผยแพร่ ไม่ใช่เอนด์พอยต์ของ PlugMCP
URL แบบรีโมตหรือคำสั่งบนเครื่องของคุณ? การติดตั้งสองแบบต่างกันอย่างไร
รันบน PlugMCP
A new server you create. It is not this listing's official endpoint. Use the publisher install when you want their URL and their credentials.
เปิดThe only Chrome extension that unifies React Timeline + Performance + Memory + Side Effects + Redux + CLS + AI analysis into a single DevTools tab — zero install in your app.
Extension version: 3.0.0 · CLI version: 2.1.2 · Author: NhoNH · License: MIT
npx @nhonh/react-debugger@latest
Then load the built extension as unpacked in chrome://extensions. Chrome Web Store listing coming soon — npx is the fastest path today.
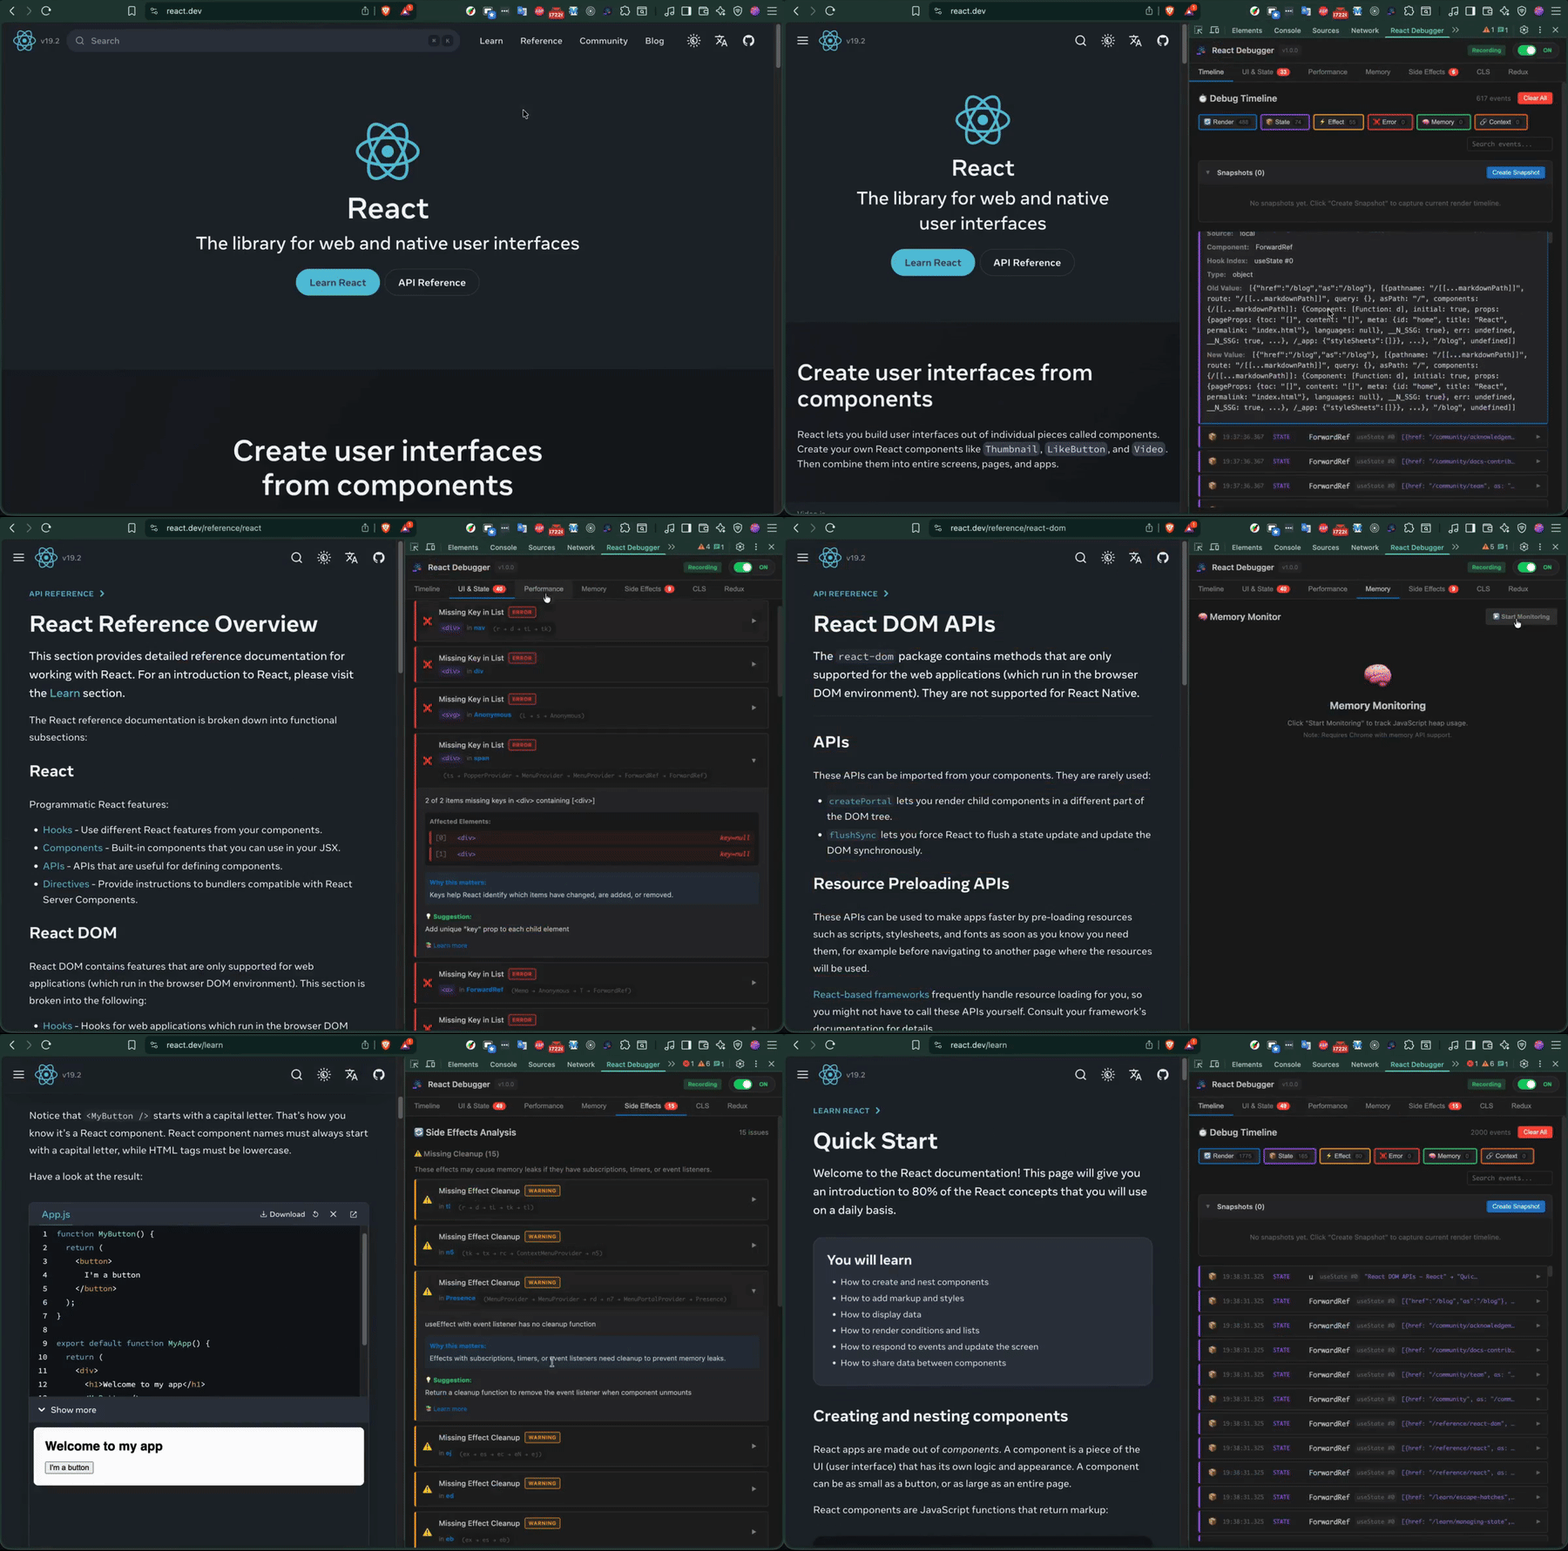
If you debug React apps in production today, you're probably switching between four tools to chase one bug:
React Debugger unifies all of this into a single DevTools tab — zero code changes in your app, with seven analyzers and an optional AI layer for security/perf/crash insight.
The defensible triple-lock no competitor combines: CLS overlay + useEffect audit + AI analysis, all in one zero-install browser panel.
| Timeline | Performance |
|---|---|
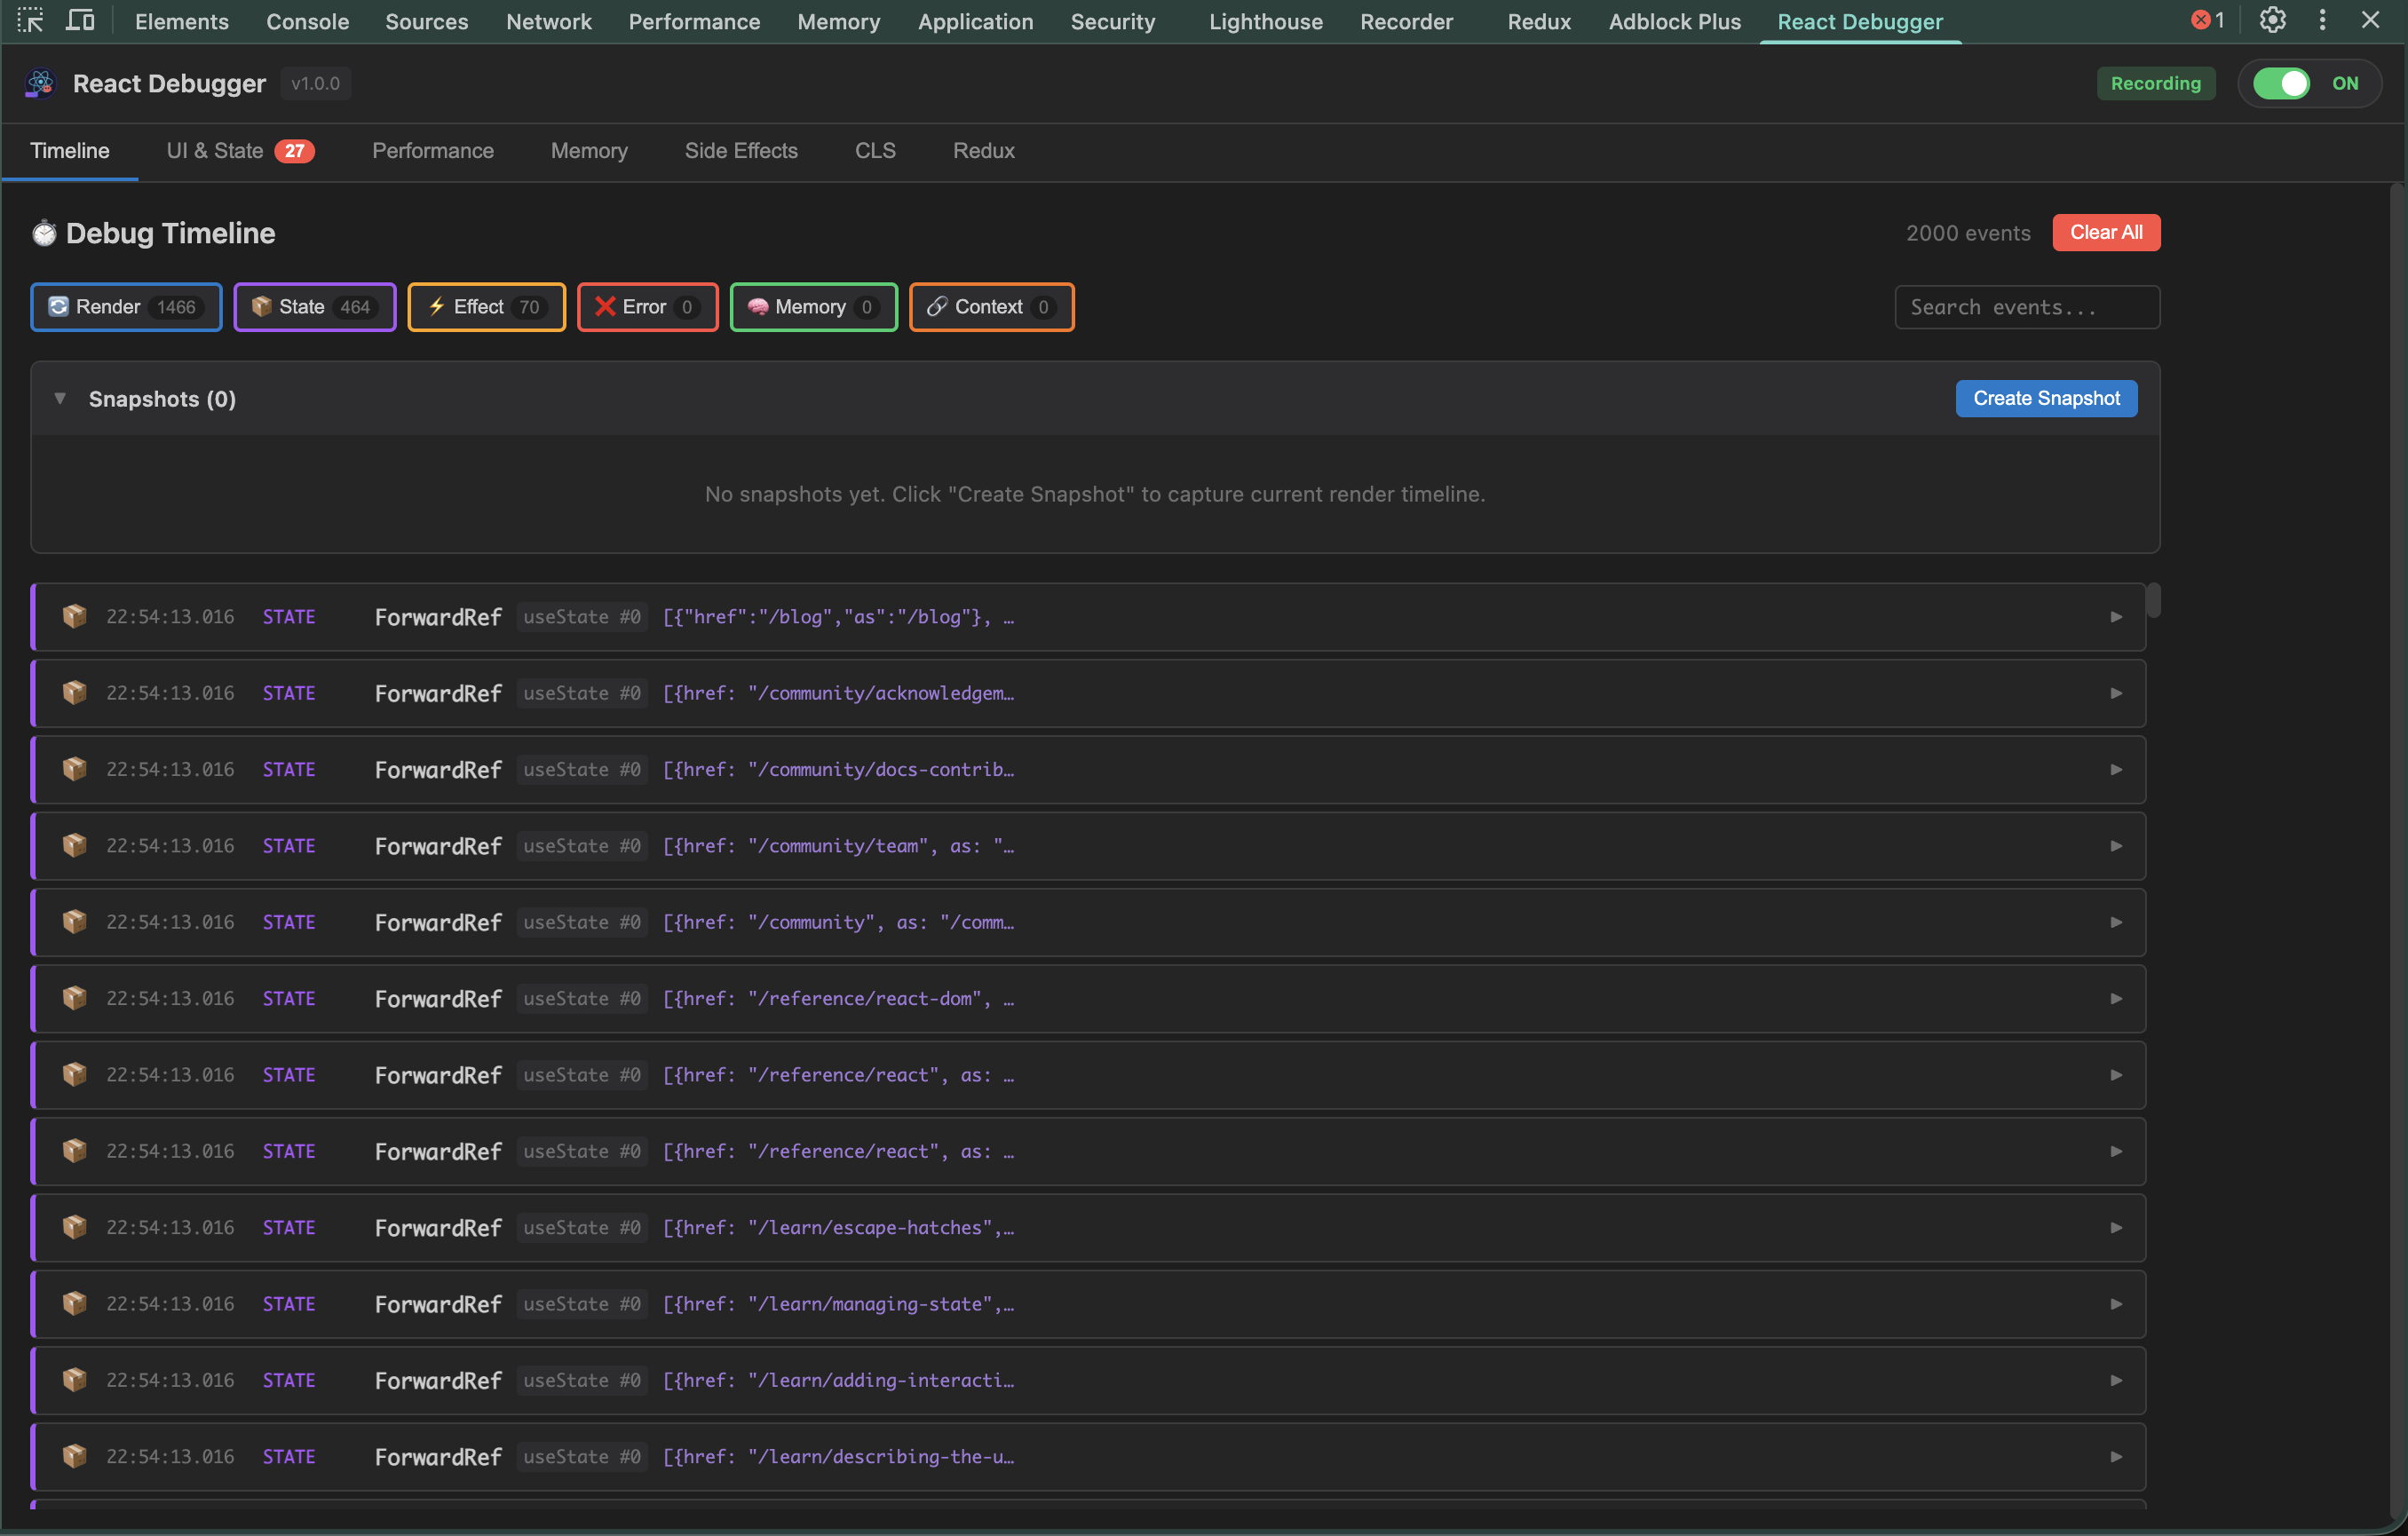 | 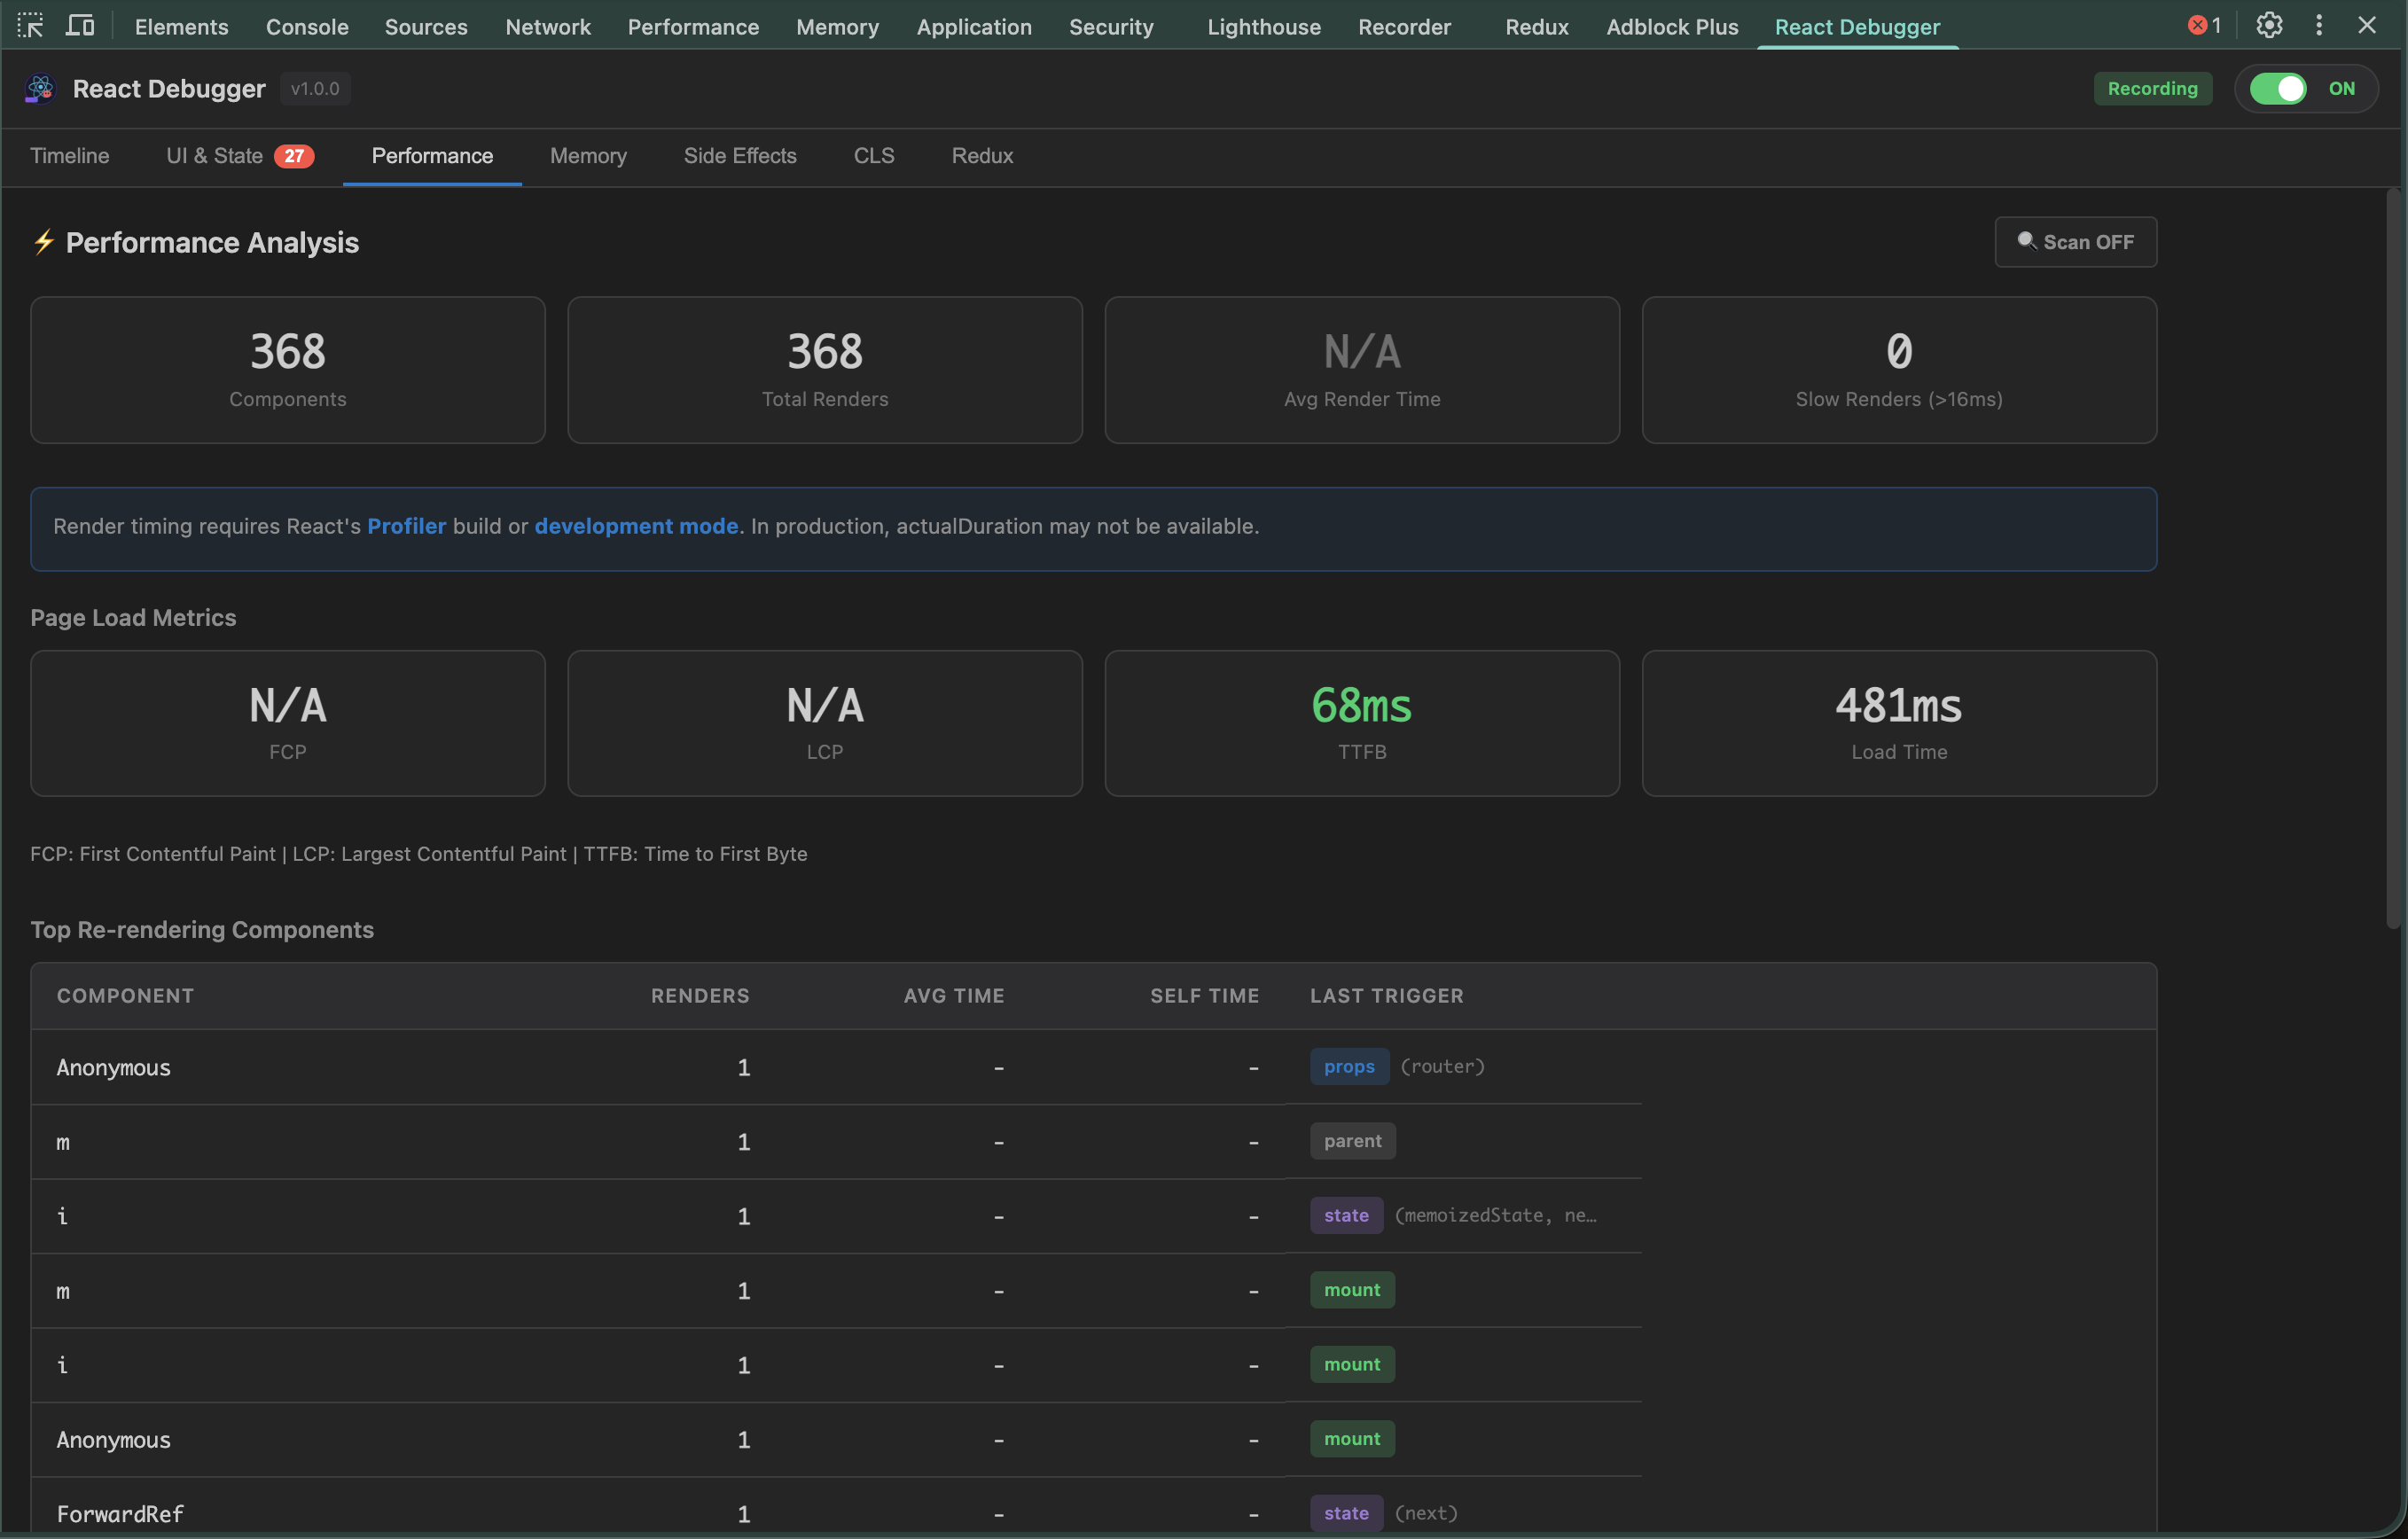 |
| Memory | Side Effects |
|---|---|
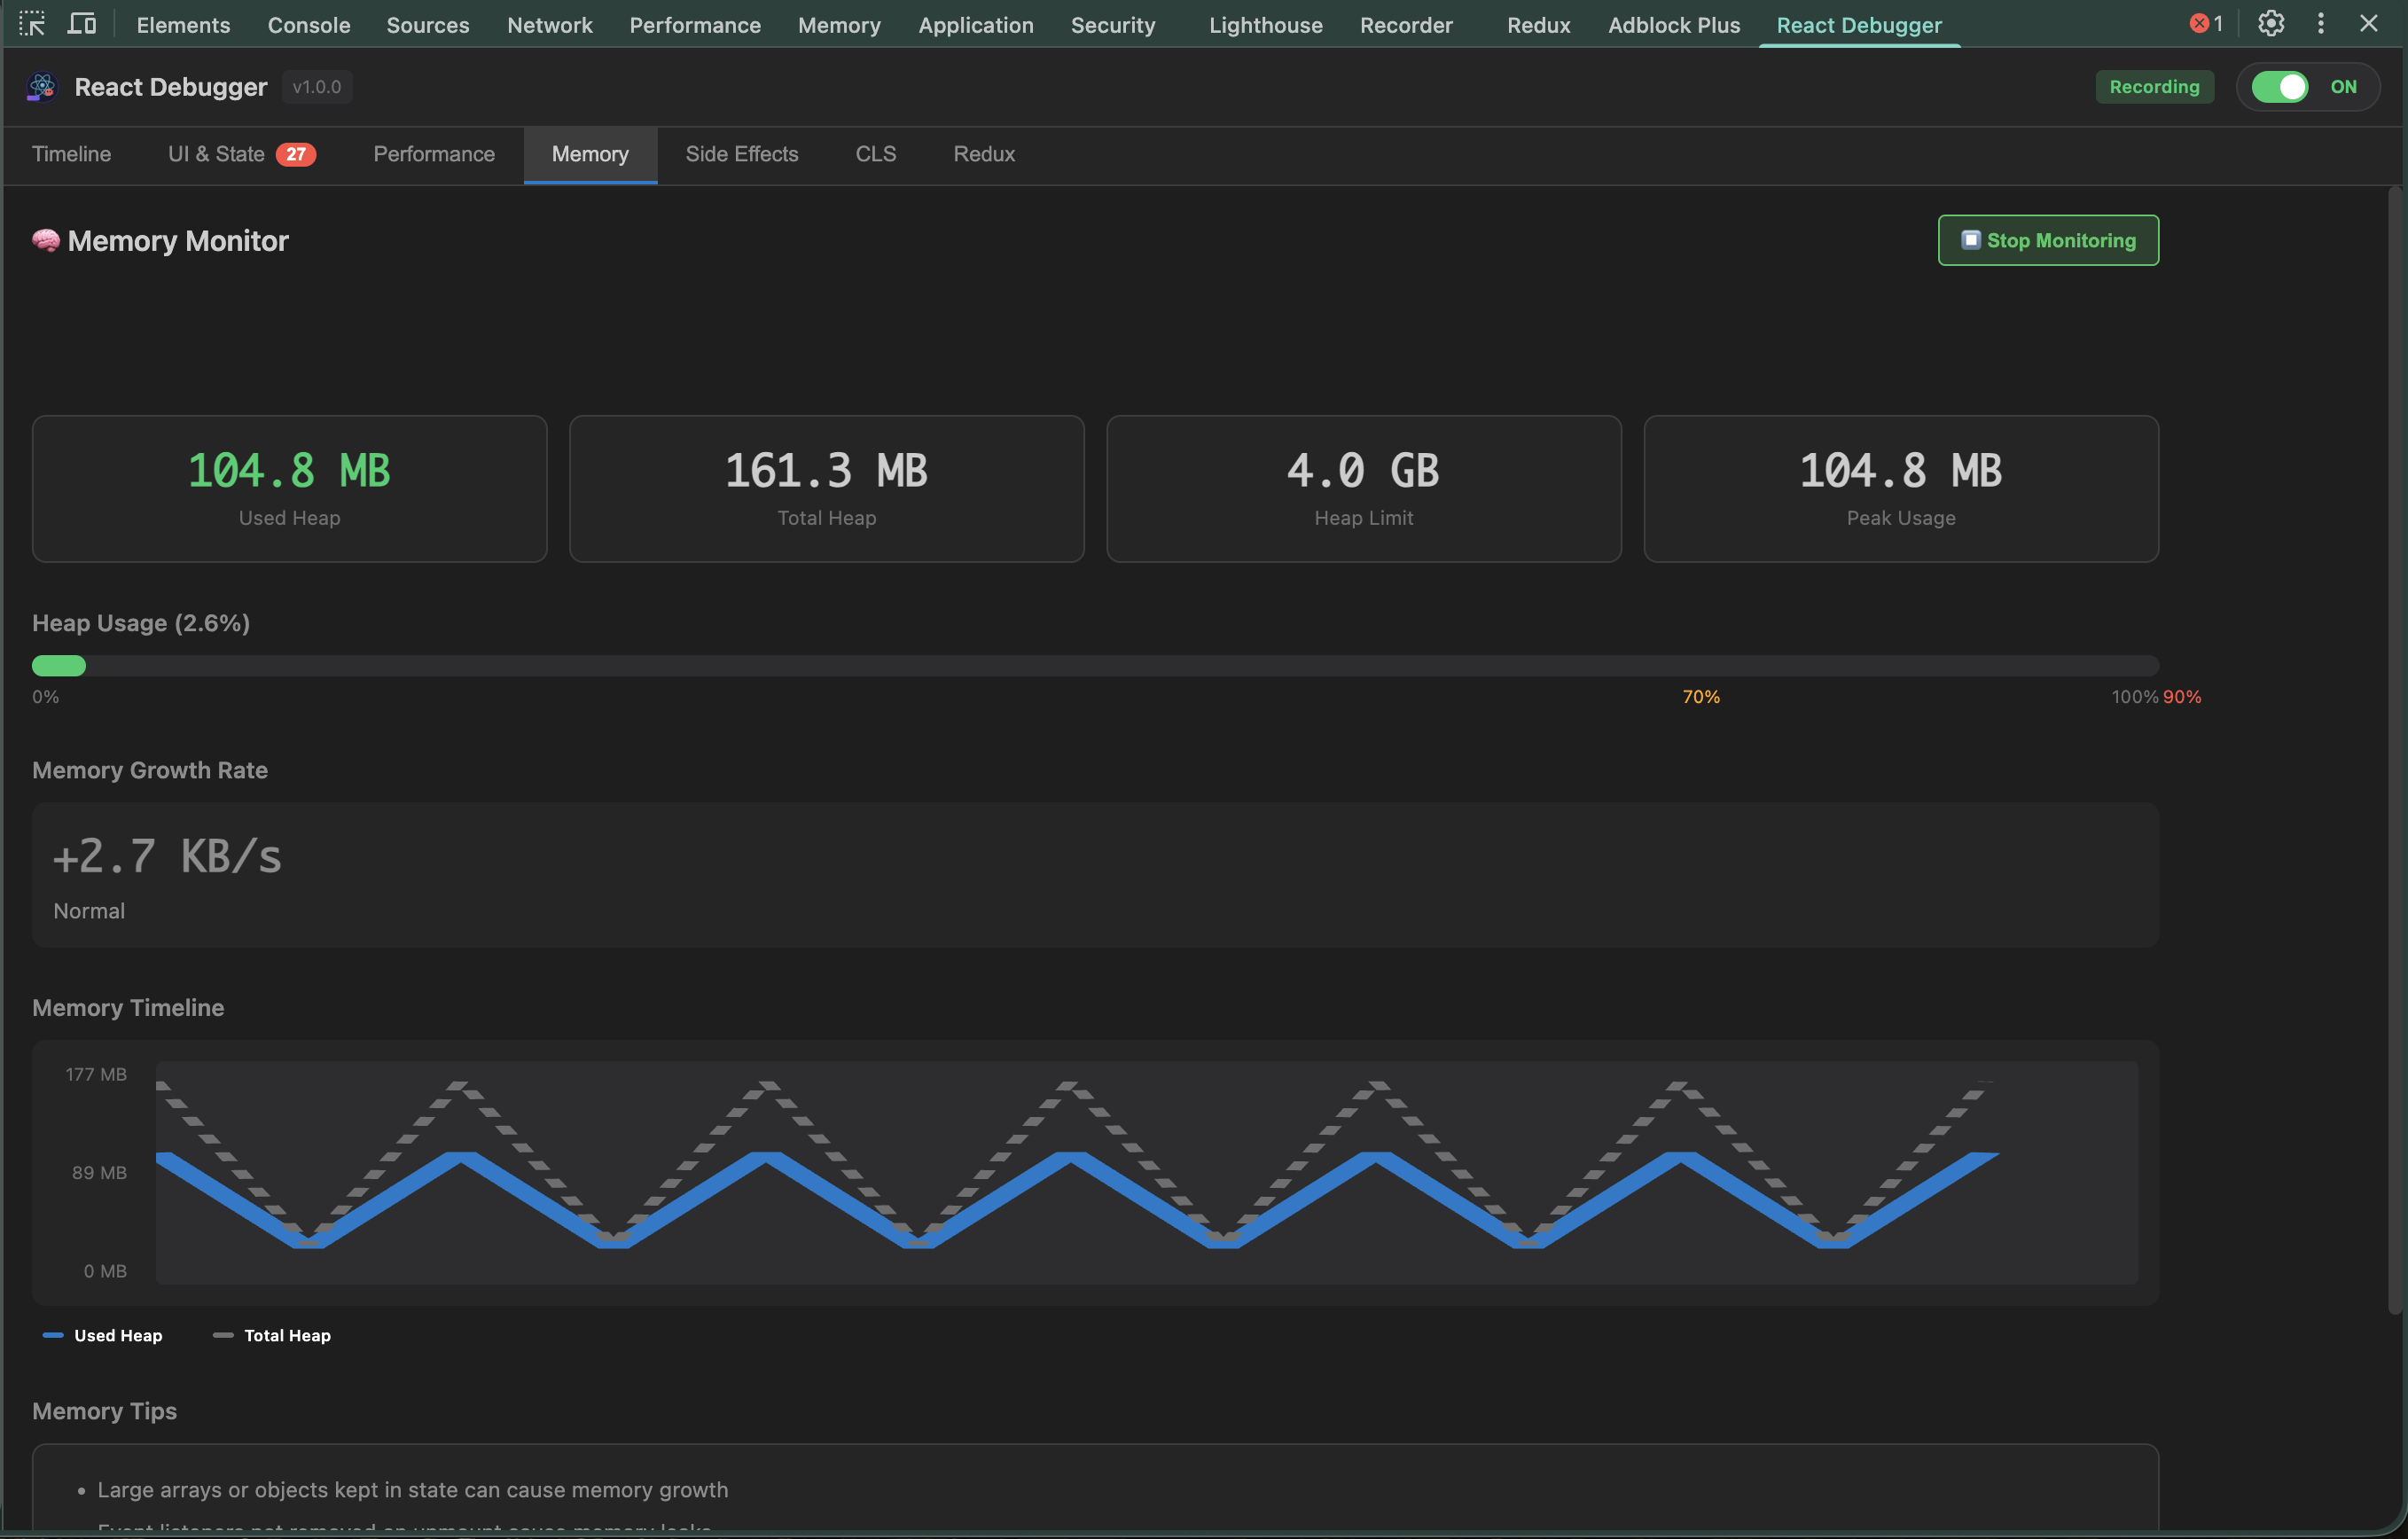 | 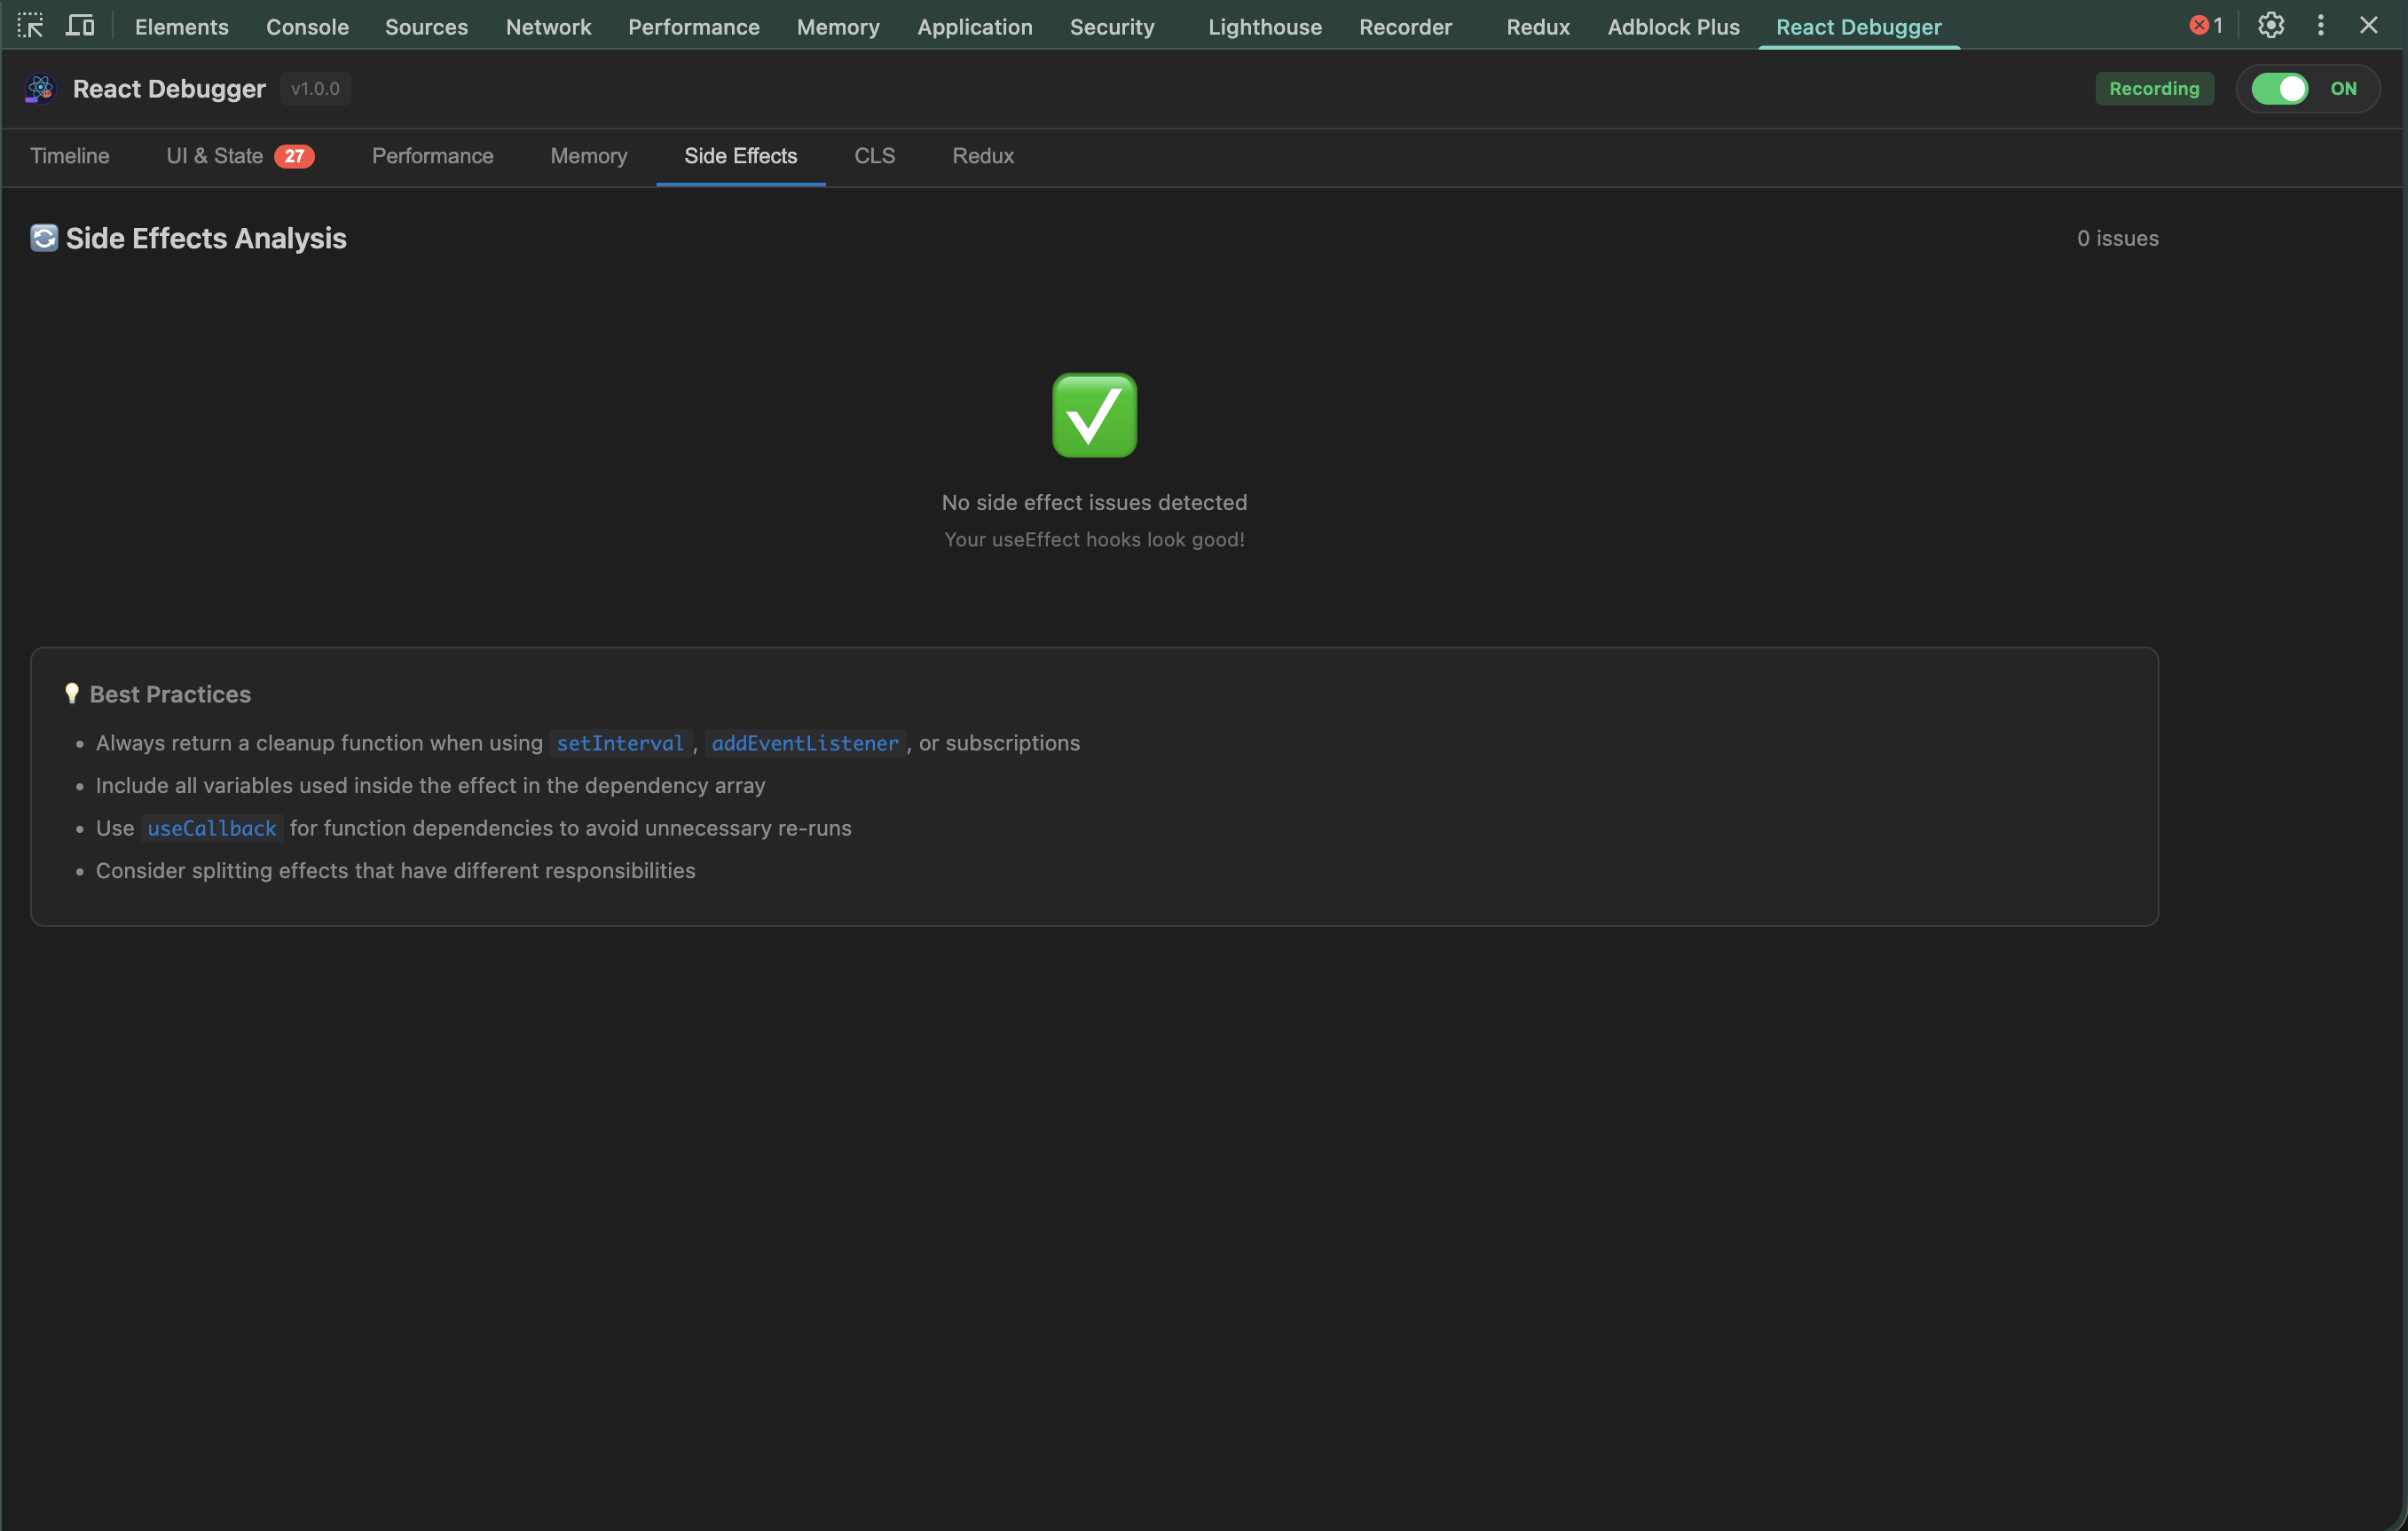 |
| CLS | Redux |
|---|---|
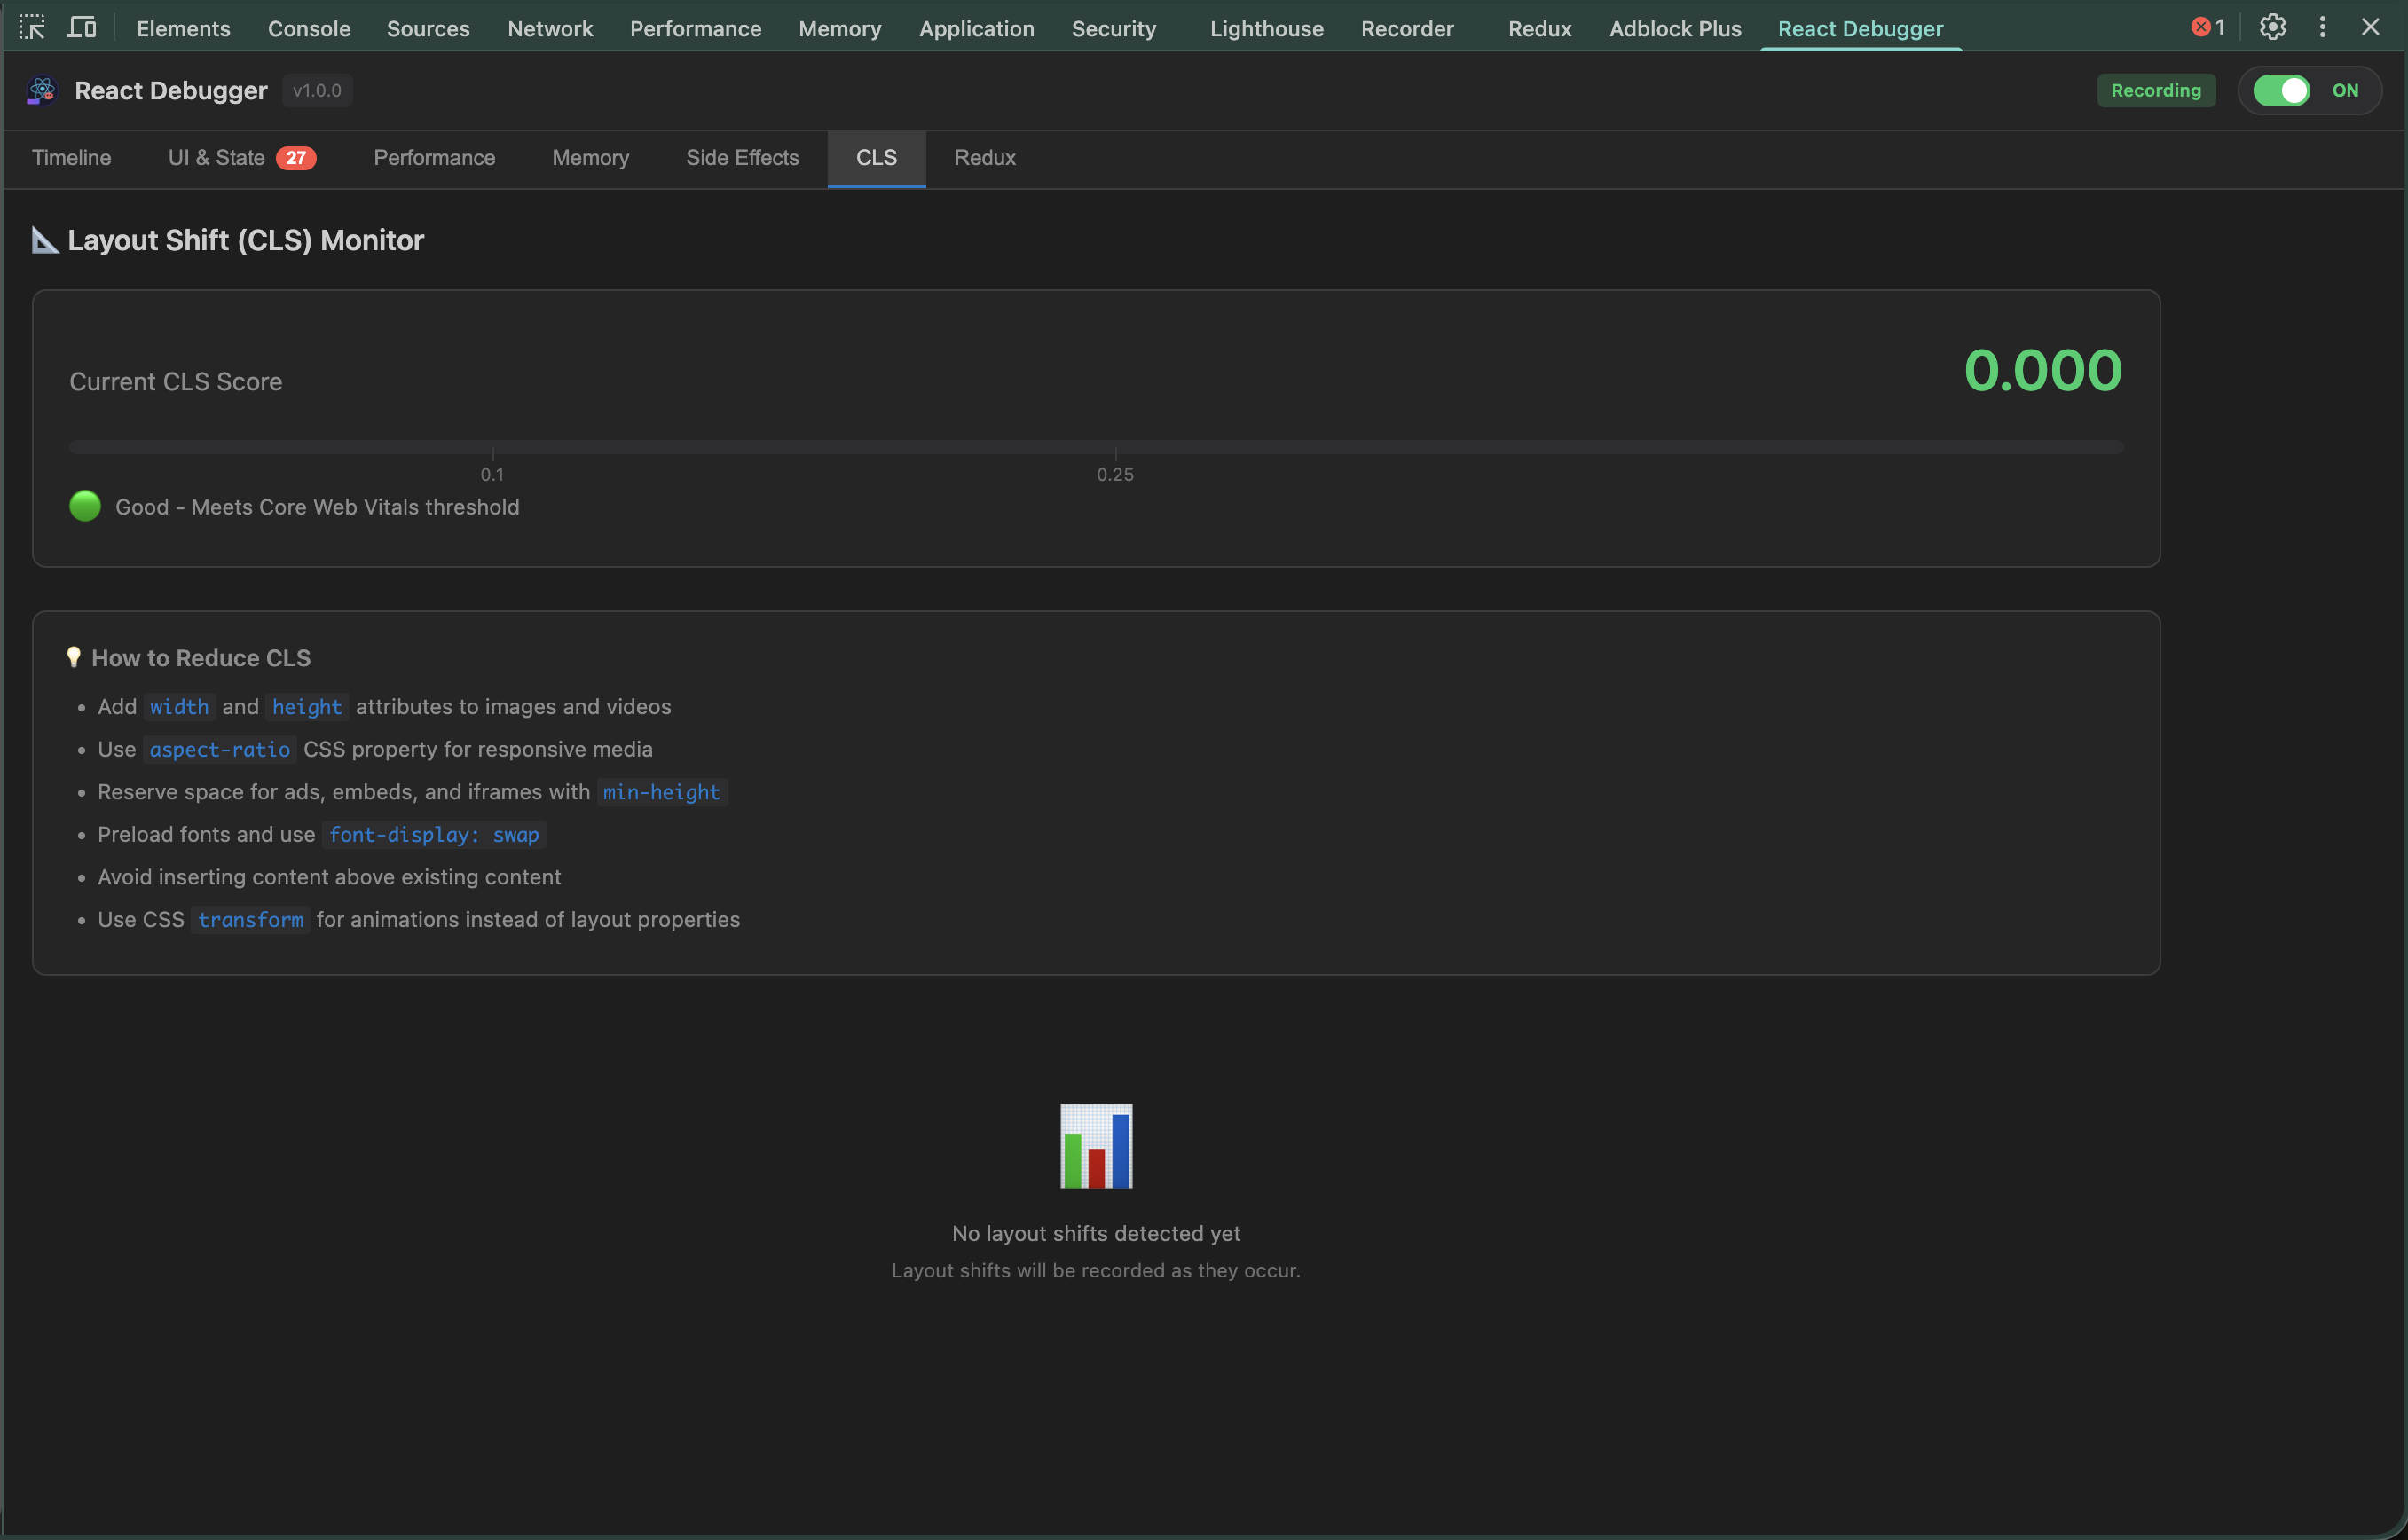 | 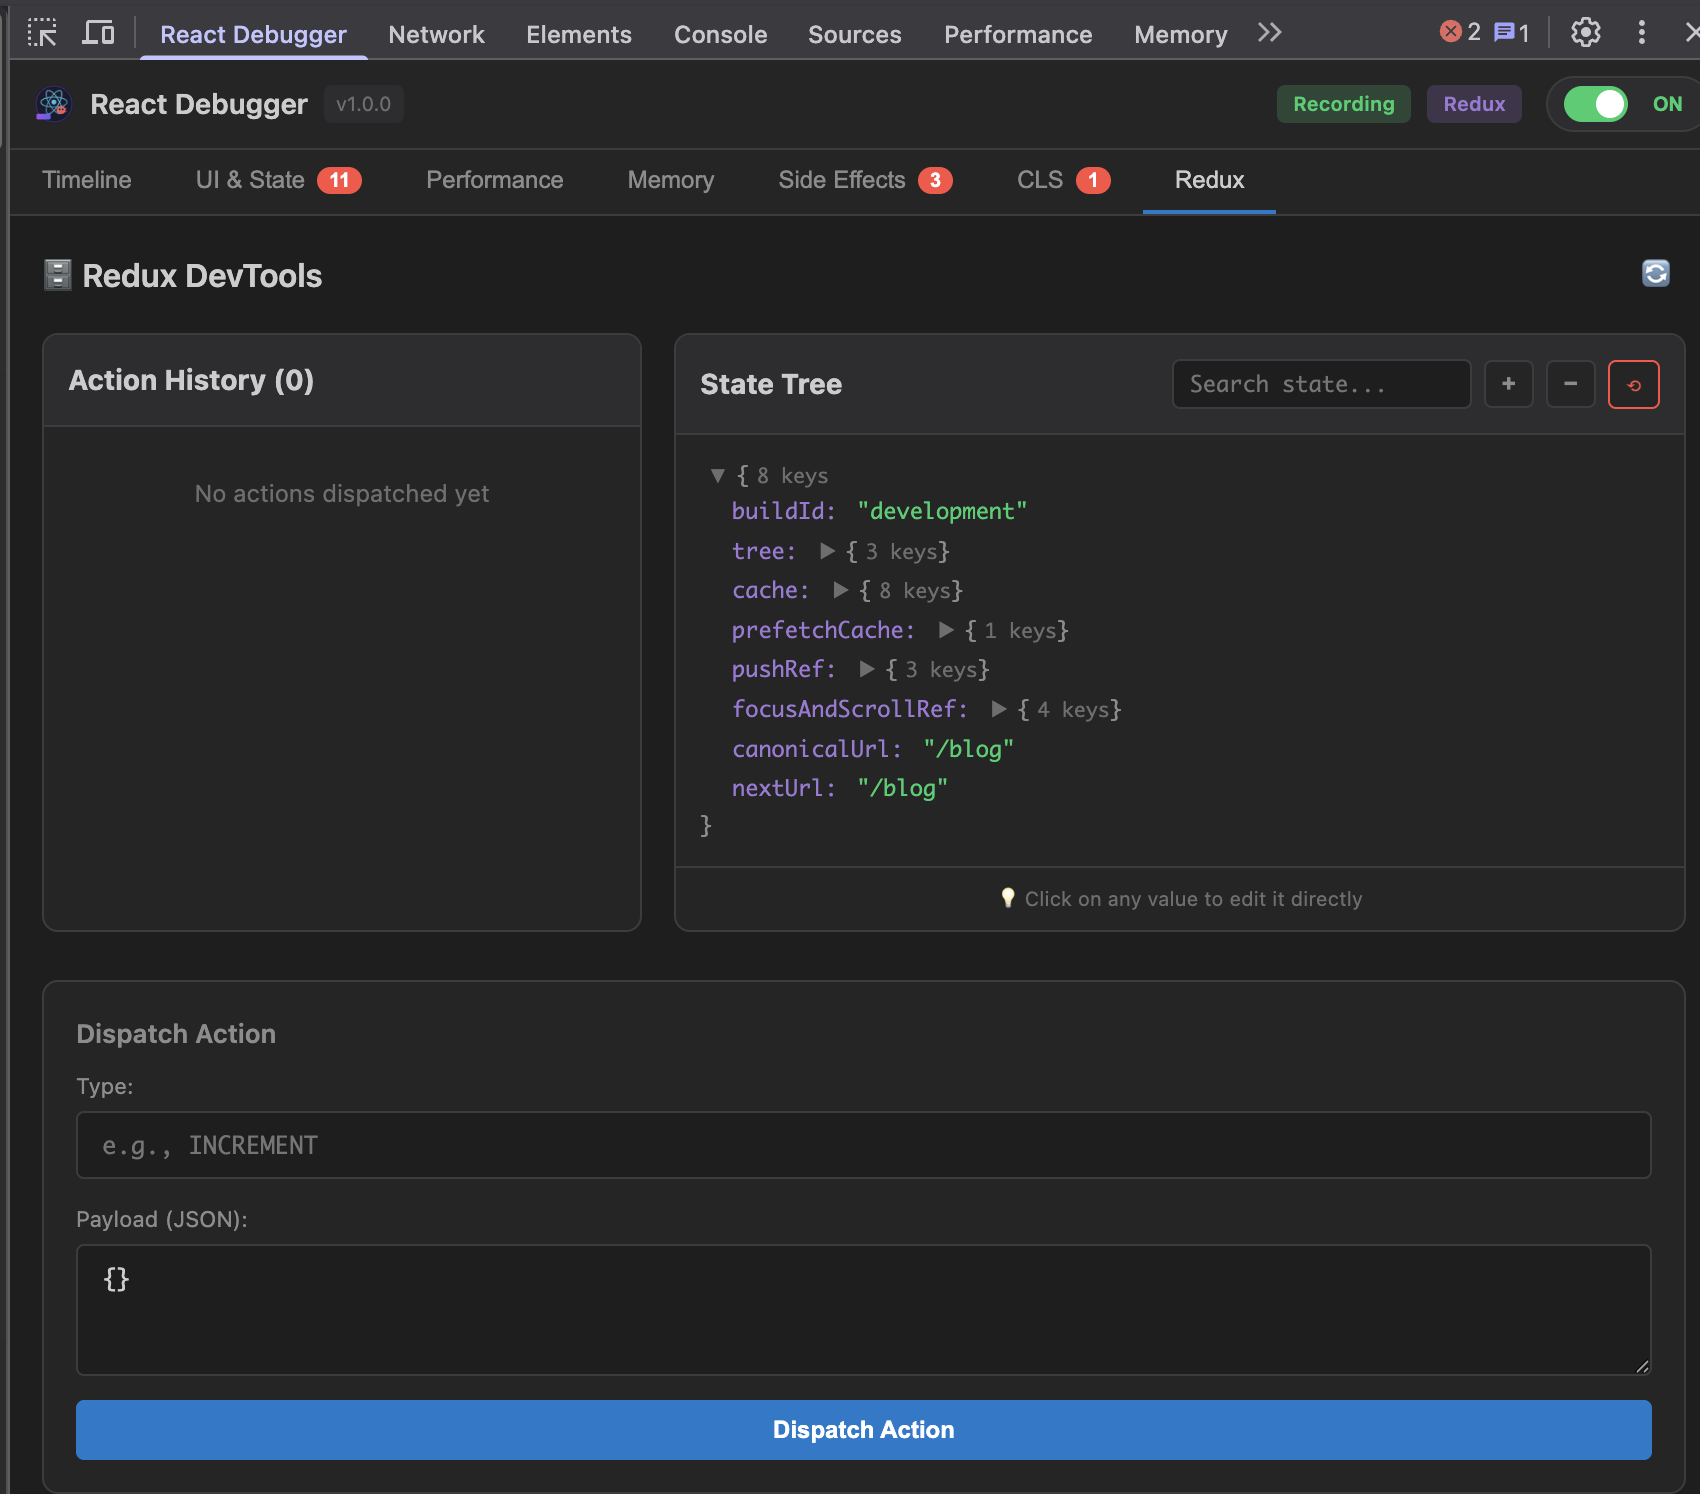 |
Bold rows = features no other tool combines into one panel.
The biggest release since launch — a full UI redesign, eight new issue detectors, an MCP server, and BYOK AI:
ChartCanvas (area / line / bars + faint grid + emphasized endpoint) powers the Memory heap-over-time timeline and the Performance render-distribution.prefers-reduced-motion, focus-visible rings, and a headless Playwright visual-regression lane.See CHANGELOG.md for the full history (including the v2.0.3 zero-lag performance work this builds on).
npx @nhonh/react-debugger
This downloads and extracts the latest extension build to your current directory. Then load it in Chrome:
chrome://extensions/You need Node 20+ and Chrome 122+.
git clone https://github.com/hoainho/react-debugger-extension.git
cd react-debugger-extension
npm ci
npm run build
Then load the dist/ folder in Chrome via the same chrome://extensions/ → Load unpacked flow.
react-debugger.zip from GitHub Releaseschrome://extensions/ → Load unpackedF12 (or Cmd+Option+I / Ctrl+Shift+I)For detailed walkthroughs of each tab, debugging strategies by skill level, and threshold reference tables, see DEBUGGING-GUIDE.md.
For 50 documented edge cases across 6 categories (Initialization, Performance Monitoring, Redux Integration, Memory & Cleanup, UI & State, CLS & Layout), see EDGE-CASES.md.
The wedge: React Debugger is the only Chrome DevTools panel that combines all seven analyzers in one tab.
npm ci                  # one-time install
npm run dev             # rebuild on change (watch mode)
npm run build           # production build → dist/
npm run test:run        # one-shot Vitest run
npm run package         # build + zip → react-debugger.zip
After every rebuild during dev, click the refresh icon on the extension card at chrome://extensions/ and reload the inspected page.
react-debugger-extension/
├── src/
│   ├── background/      # Service worker
│   ├── content/         # Content script (CLS monitoring)
│   ├── inject/          # Page script (React fiber hook, bippy-aligned)
│   ├── devtools/        # DevTools page entry
│   ├── panel/
│   │   ├── components/  # Reusable components
│   │   ├── tabs/        # 8 tab components incl. AI Analysis
│   │   └── styles/      # CSS (with prefers-reduced-motion support)
│   ├── services/        # AI client, token optimizer, snapshot builder
│   ├── types/           # TypeScript types
│   ├── utils/           # Utilities (sanitize, messaging)
│   └── __tests__/       # Vitest unit tests (170 tests across 9 files)
├── cli/                 # @nhonh/react-debugger npm package
├── worker/              # Cloudflare Worker (AI subscription key validation)
├── test/
│   └── fixtures/basic/  # E2E fixture app for Playwright (Vite + React 18)
├── docs/                # Landing page (hoainho.github.io/react-debugger-extension)
└── openspec/            # In-flight design proposals (growth campaign, MCP server v1)
dist/ folder, not the repo rootchrome://extensions/ for errorsdocument_startv2.0.3 specifically targeted host-page lag. If you still see it, please open a bug with Chrome version, extension version, and the inspected page URL.
We welcome contributions of all sizes. The fastest way in:
@hoainho I'll take thisWe also have help wanted items for larger contributions.
Active design work lives in openspec/changes/:
mcp-server-v1/ — adding a Model Context Protocol server so LLM coding agents (Claude Desktop, opencode, Cursor) can drive the extension's debugging tools programmatically. Currently in spec phase; first contributor PRs are already landing scaffolding.growth-and-contributor-attraction/ — 90-day plan to grow the project and contributor base. Week 1 (license + on-ramp) shipped May 2026.Every star helps more React developers discover the project — and it's the single most useful signal you can send the maintainer that the work matters. One click. Big difference.
You can also 👀 Watch releases to get notified when new tabs (or the MCP server) ship.
MIT — Copyright © 2025-2026 NhoNH.
React and the React logo are trademarks of Meta Platforms, Inc. This extension is not affiliated with or endorsed by Meta or the React team.
React debugging in Chrome DevTools: a 5-view panel (Dashboard/Profiler/State/Effects/Settings) with render+memory profiling, issue detectors, a Redux inspector, AI analysis, and an MCP server for codi
ภาพรวม
React debugging in Chrome DevTools: a 5-view panel (Dashboard/Profiler/State/Effects/Settings) with render+memory profiling, issue detectors, a Redux inspector, AI analysis, and an MCP server for coding agents.
เครื่องมือ
ยังไม่มีรายการเครื่องมือ เซิร์ฟเวอร์แบบรีโมตจะได้รายการหลังการตรวจสอบสถานะครั้งแรก
FAQ
คัดลอกคอนฟิก stdio สำหรับ Cursor, Claude Desktop, Claude Code หรือ VS Code ได้ในหน้านี้ คอนฟิกนี้ใช้การติดตั้งของผู้เผยแพร่ ไม่ใช่พร็อกซีของ PlugMCP
ระเบียนนี้ไม่ได้ระบุตัวแปรสภาพแวดล้อมที่จำเป็น
React Debugger Extension ทำงานแบบโลคัลผ่าน stdio
ตรวจสอบล่าสุดเมื่อ 2026-10-27 React debugging in Chrome DevTools: a 5-view panel (Dashboard/Profiler/State/Effects/Settings) with render+memory profiling, issue detectors, a Redux inspector, AI analysis, and an MCP server for coding agents.