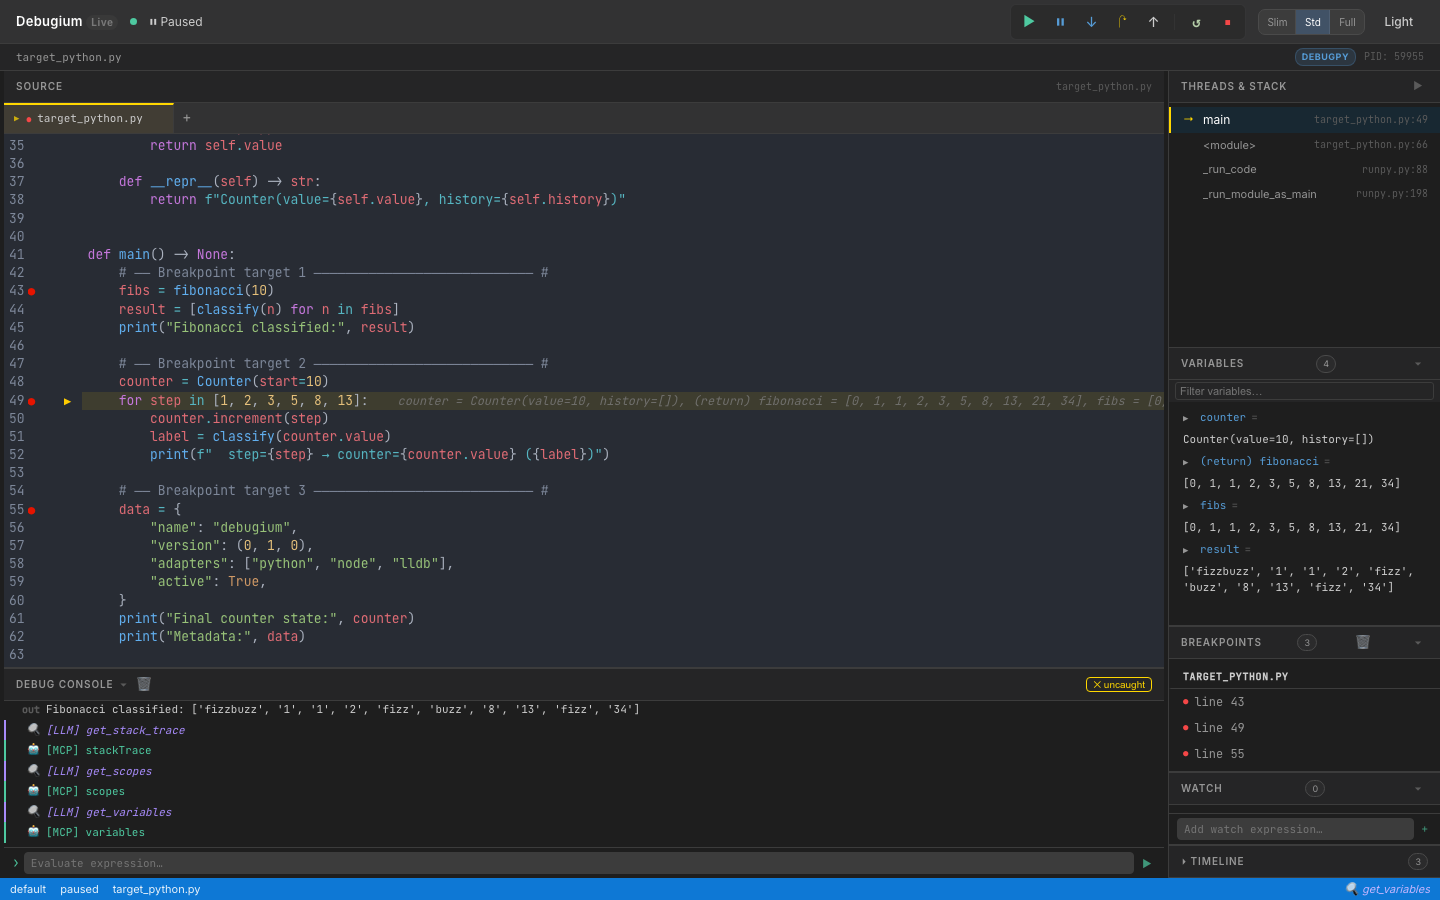
A multi-language debugger with a real-time web UI and LLM integration via MCP.
Debug Python, JavaScript, TypeScript, C, C++, Rust, Java, Scala, and WebAssembly programs from your browser — with AI-driven analysis through the Model Context Protocol.
AI-driven live debugger with MCP bridge for Python, JS, TS, Rust, Java, C/C++
2026-11-08
ดาว
—
เครื่องมือ
—
อัปไทม์
—
Features
Web UI
Real-time web UI — source viewer, breakpoints, variables (recursive expansion), call stack, console, timeline, watch expressions, findings — all updated live via WebSocket
Multi-tab source viewer — open multiple files, click stack frames to navigate
Variable search — filter variables by name with recursive expansion
Changed-variable highlighting — variables that changed since last stop shown in orange
Thread selector — switch between threads in multi-threaded programs
Panel collapse & resize — drag to resize, toggle to collapse; Slim / Standard / Full layout presets
Dark / light mode toggle
Auto-reconnect — UI reconnects after a dropped WebSocket, with visual status indicator
Keyboard shortcuts — F5 continue, F10 step over, F11 step in, Shift+F11 step out, Ctrl/Cmd+D dark mode
Button animations — in-flight spinner and completion flash for debug commands
Debugging
Multi-language — Python (debugpy), Node.js/TypeScript (js-debug), C/C++/Rust (lldb-dap), Java (java-debug), Scala (Metals), WebAssembly (lldb-dap), or any DAP adapter via dap.json
Comprehensive DAP coverage — 35+ DAP requests: breakpoints, stepping, goto, memory read/write, disassembly, and more
# C or C++ (compile with -g for debug info)
cc -g -O0 main.c -o main && debugium launch ./main --adapter lldb
c++ -g -O0 main.cpp -o main && debugium launch ./main --adapter lldb

# Rust
cargo build && debugium launch target/debug/my_binary --adapter lldb
# Python (debugpy listening on port 5678)
debugium attach --port 5678 --adapter python

# Java (JDWP on port 5005)
debugium attach --port 5005 --adapter java

# Node.js (inspector on port 9229)
debugium attach --port 9229 --adapter node
Or via MCP: attach_session(port=5678, adapter="python", breakpoints=["/path/app.py:42"])
Use a custom adapter via dap.json
# Create a dap.json (see dap.json.example) then:
debugium launch my_program --config ./dap.json

# Or place dap.json in cwd / .debugium/ for auto-discovery:
debugium launch my_program   # finds ./dap.json automatically
Claude Code will now have access to all Debugium MCP tools. See CLAUDE.md for
the recommended workflow and SKILL.md for the full tool reference.
CLI Control Commands
Once a session is running (debugium launch …), you can drive it from a second terminal — or from an LLM agent — without touching the web UI.
Port is auto-discovered from ~/.debugium/port; override with --port.
Global flags (all subcommands)
Flag
Default
Description
--port PORT
~/.debugium/port
Server port to connect to
--session ID
default
Session to target
--json
off
Print raw JSON instead of human-readable output
Inspection
debugium sessions                  # list active sessions
debugium threads                   # list threads
debugium stack                     # show call stack
debugium vars                      # show local variables (auto-resolves top frame)
debugium vars --frame-id 2         # show variables for a specific frame
debugium eval "len(fibs)"          # evaluate expression in top frame
debugium eval "x + 1" --frame-id 2
debugium source path/to/file.py    # print full source file
debugium source path/to/file.py --line 43  # windowed ±10 lines with → marker
debugium context                   # full snapshot: paused-at, stack, locals, source, breakpoints
debugium context --compact         # same but truncated (3 frames, 10 vars)
Breakpoints
debugium bp set FILE:LINE [FILE:LINE …]   # set breakpoints (replaces existing in that file)
debugium bp list                          # list all breakpoints
debugium bp clear                         # clear all breakpoints
Execution control
debugium continue                  # resume execution
debugium step over                 # step over (next line)
debugium step in                   # step into a function call
debugium step out                  # step out of current function
# Terminal A — start the session
debugium launch tests/target_python.py --adapter python \
  --breakpoint "$(pwd)/tests/target_python.py:43"

# Terminal B (or LLM agent) — inspect and drive it
debugium sessions
debugium stack
debugium vars
debugium eval "len(fibs)"
debugium bp set tests/target_python.py:49
debugium continue                  # runs to line 49
debugium vars
debugium step over
debugium context --json            # machine-readable snapshot
debugium annotate tests/target_python.py:43 "called here" --color info
debugium finding "fibs has 10 elements" --level info
debugium bp clear
MCP Tools
When connected via MCP, 64 tools are available. Key ones:
Category
Tools
Orient
get_debug_context ★ (paused location + locals + stack + source in one call)
Note: step_over, step_in, and step_out are blocking — they wait for the
adapter to pause before returning. Safe to chain back-to-back without sleeps.
continue_execution returns console_line_count for use with wait_for_output.
Tools like read_memory, goto, and restart_frame only appear when the adapter supports them.
See SKILL.md for the full reference with input schemas.
Keyboard Shortcuts
Key
Action
F5
Continue
F10
Step Over
F11
Step Into
Shift+F11
Step Out
Ctrl/⌘+D
Toggle dark/light mode
Architecture
debugium-server (Rust + Axum)
├── DAP proxy     — spawns / attaches to debug adapters (debugpy, js-debug, lldb-dap, java-debug, Metals, custom)
├── HTTP API      — /state, /sessions, /annotations, /findings, /watches, /timeline
├── WebSocket     — broadcasts DAP events + enriched stop data (changed vars, timeline) to UI
├── MCP stdio     — JSON-RPC 2.0 server exposing 64 tools for LLM integration
├── CLI control   — 13 subcommands to drive sessions from a second terminal
└── ~/.debugium/  — port file, session logs (events.ndjson), debug log

debugium-ui (Leptos + WASM)
├── CodeMirror 6  — source viewer with breakpoint gutters, exec arrow, LLM annotations, multi-tab
├── Reactive panels — Variables, Stack, Breakpoints, Findings, Watch, Timeline, Console (18 components)
└── WebSocket     — receives events, sends DAP commands, auto-reconnects with status indicator