JDB-MCP: Java Debugger MCP Server
JDB-MCP is a Model Context Protocol (MCP) server based on the Java Debug Interface (JDI). It enables AI agents (such as Claude, Cline, Trae) to perform deep runtime debugging of Java applications.
接入你的智能体
從發布者安裝。不是 PlugMCP 端點。
遠端 URL 還是本機指令? 兩種安裝方式的差異
來自發布者
JDB-MCP is a Model Context Protocol (MCP) server based on the Java Debug Interface (JDI). It enables AI agents (such as Claude, Cline, Trae) to perform deep runtime debugging of Java applications.
Java Debugger MCP Server. Enables AI agents to debug live Java apps via JDI with breakpoints, stack tracing, and variable inspection.
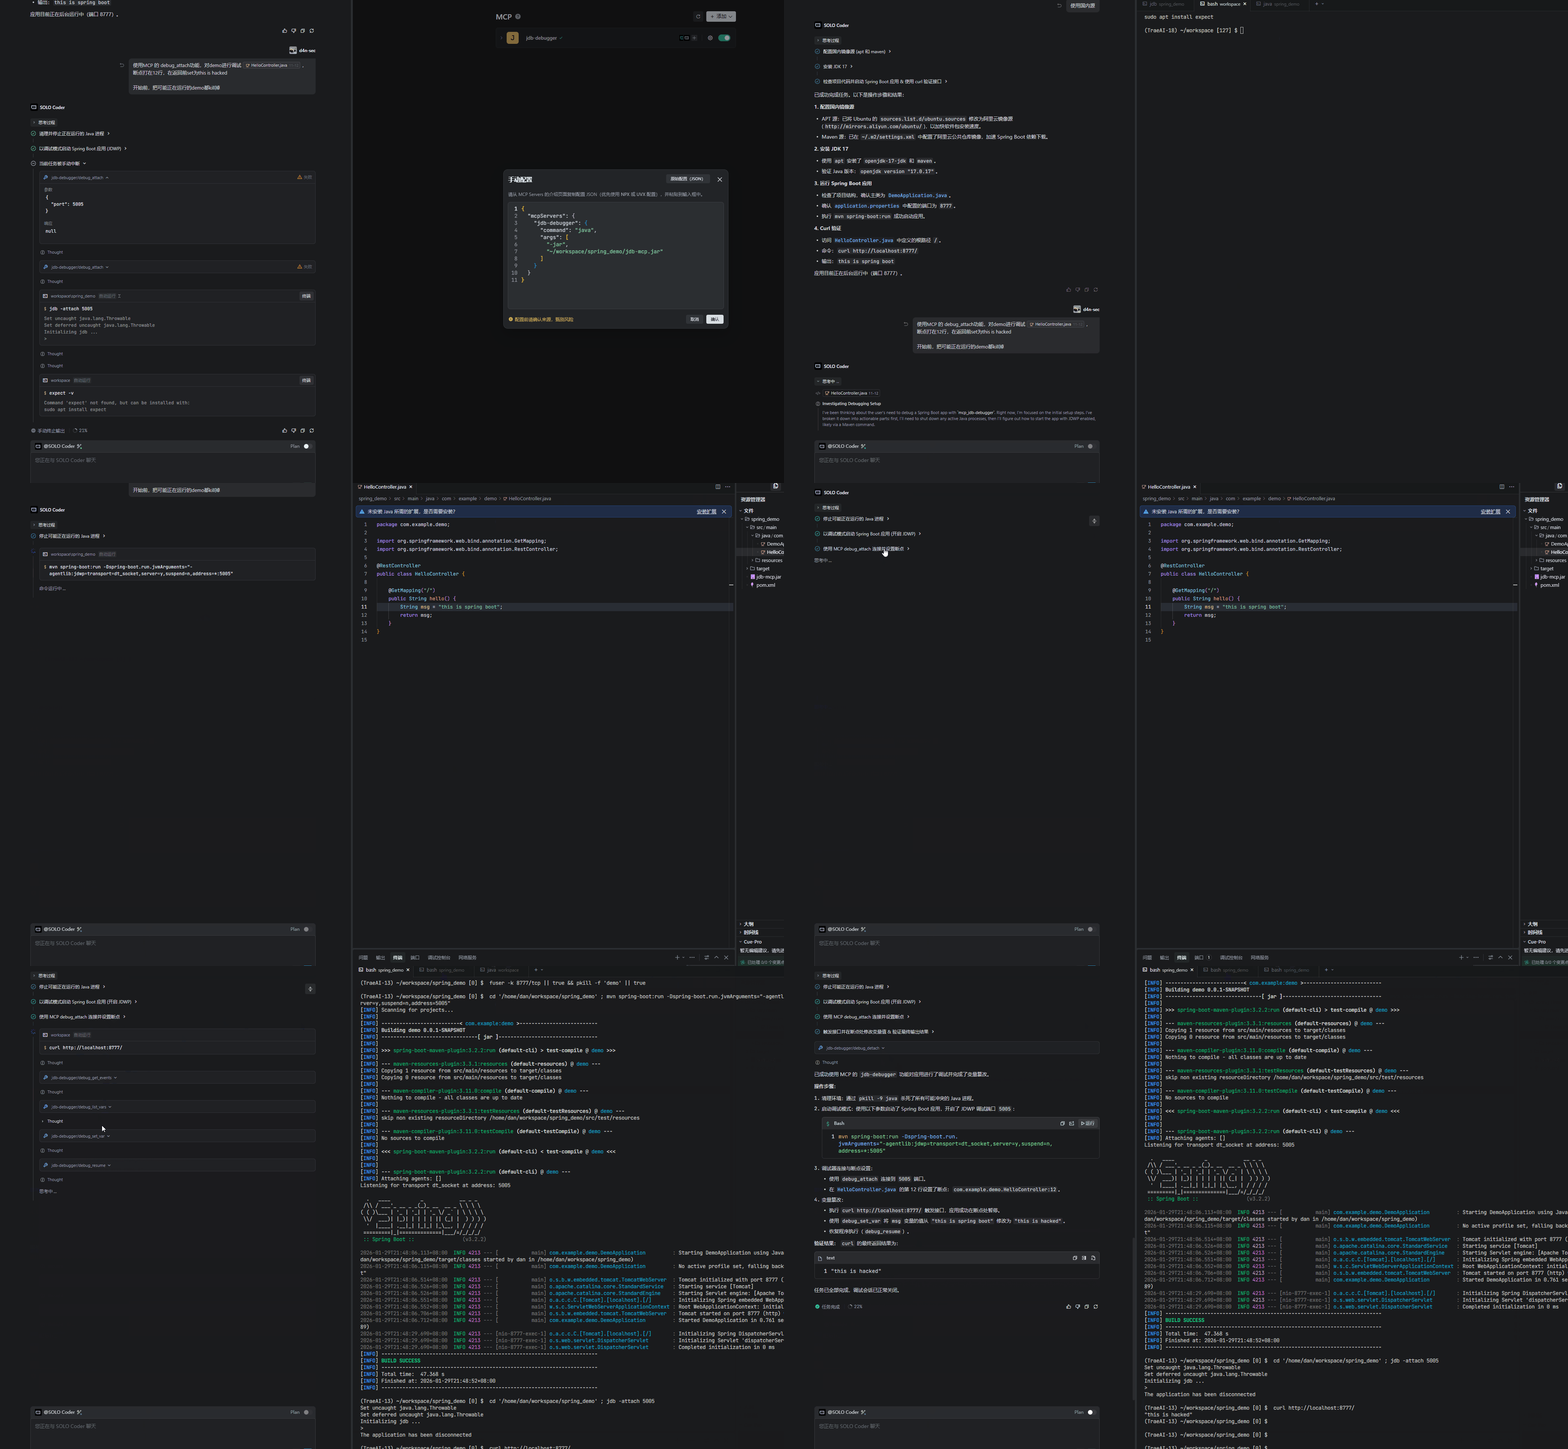
stdio (standard VSCode integration) and http (for remote/curl debugging).debug_attach) - Supports any Java application (SpringBoot, Maven, Gradle, etc.) with JDWP enabled.debug_set_breakpoint, debug_set_watchpoint)debug_list_threads, debug_list_classes)sessionId management.# Build all modules and generate JARs in the `release/` directory
mvn clean package
# Or build for a specific JDK version:
# For JDK 17+ (Recommended)
mvn clean package -pl jdb-mcp-jdk17 -am
# For JDK 7 (Legacy Support)
mvn clean package -pl jdb-mcp-jdk7 -am
The executable JARs will be located in the release/ directory:
release/jdb-mcp.jar (JDK 17+)release/jdb-mcp-jdk7.jar (JDK 7)--transport <stdio|http>: Set transport mode (default: stdio).--notifications <true|false>: Enable real-time AI notifications (default: true).For detailed tool parameter analysis, please refer to the Parameter Guide.
Add the following configuration to your MCP settings:
{
  "mcpServers": {
    "jdb-debugger": {
      "command": "java",
      "args": [
        "-jar",
        "path/to/jdb-mcp.jar"
      ]
    }
  }
}
Important: You must manually start your target Java application with JDWP enabled.
java -agentlib:jdwp=transport=dt_socket,server=y,suspend=n,address=*:5005 -jar your-app.jar
Attach to localhost:5005 and debug...debug_attach: Attach to an existing debug port via Socket.debug_list_threads: List all threads and their status.debug_list_classes: List loaded classes with optional filtering.debug_list_methods: List methods in a specific class.debug_source: Retrieve source code for a class (requires source roots).debug_set_method_breakpoint: Set a breakpoint at method entry.debug_set_method_entry: Monitor method entry events.debug_set_method_exit: Monitor method exit events.debug_list_vars: List variables (supports threadName, frameIndex and scope filter).debug_get_var: Get detailed info for a specific variable.debug_set_var: Modify runtime variables (supports threadName and frameIndex).tools/list).debug_launch: Enable "out-of-the-box" experience by allowing users to launch and debug Java programs directly through the MCP.debug_calc: Support evaluating arbitrary Java expressions in the debug context (Expression Evaluation).com.example.*) for method entry/exit and breakpoints.Open-sourced under the MIT License.
Java Debugger MCP Server. Enables AI agents to debug live Java apps via JDI with breakpoints, stack tracing, and variable inspection.
工具
尚無工具清單。遠端伺服器會在首次健康檢查後取得工具清單。
常見問題
在本頁複製適用於 Cursor、Claude Desktop、Claude Code 或 VS Code 的 stdio 設定。它使用發布者的安裝方式,而不是 PlugMCP 代理伺服器。
這筆記錄未列出必要的環境變數。
Jdb 透過 stdio 在本機執行。
上次檢查時間:2026-10-27。 Java Debugger MCP Server. Enables AI agents to debug live Java apps via JDI with breakpoints, stack tracing, and variable inspection.
