Self-hosted analytics for MCP servers: which tools, resources and prompts get used, by which client, how fast, and why they fail.
2026-10-28
星數
—
工具
—
可用率
—
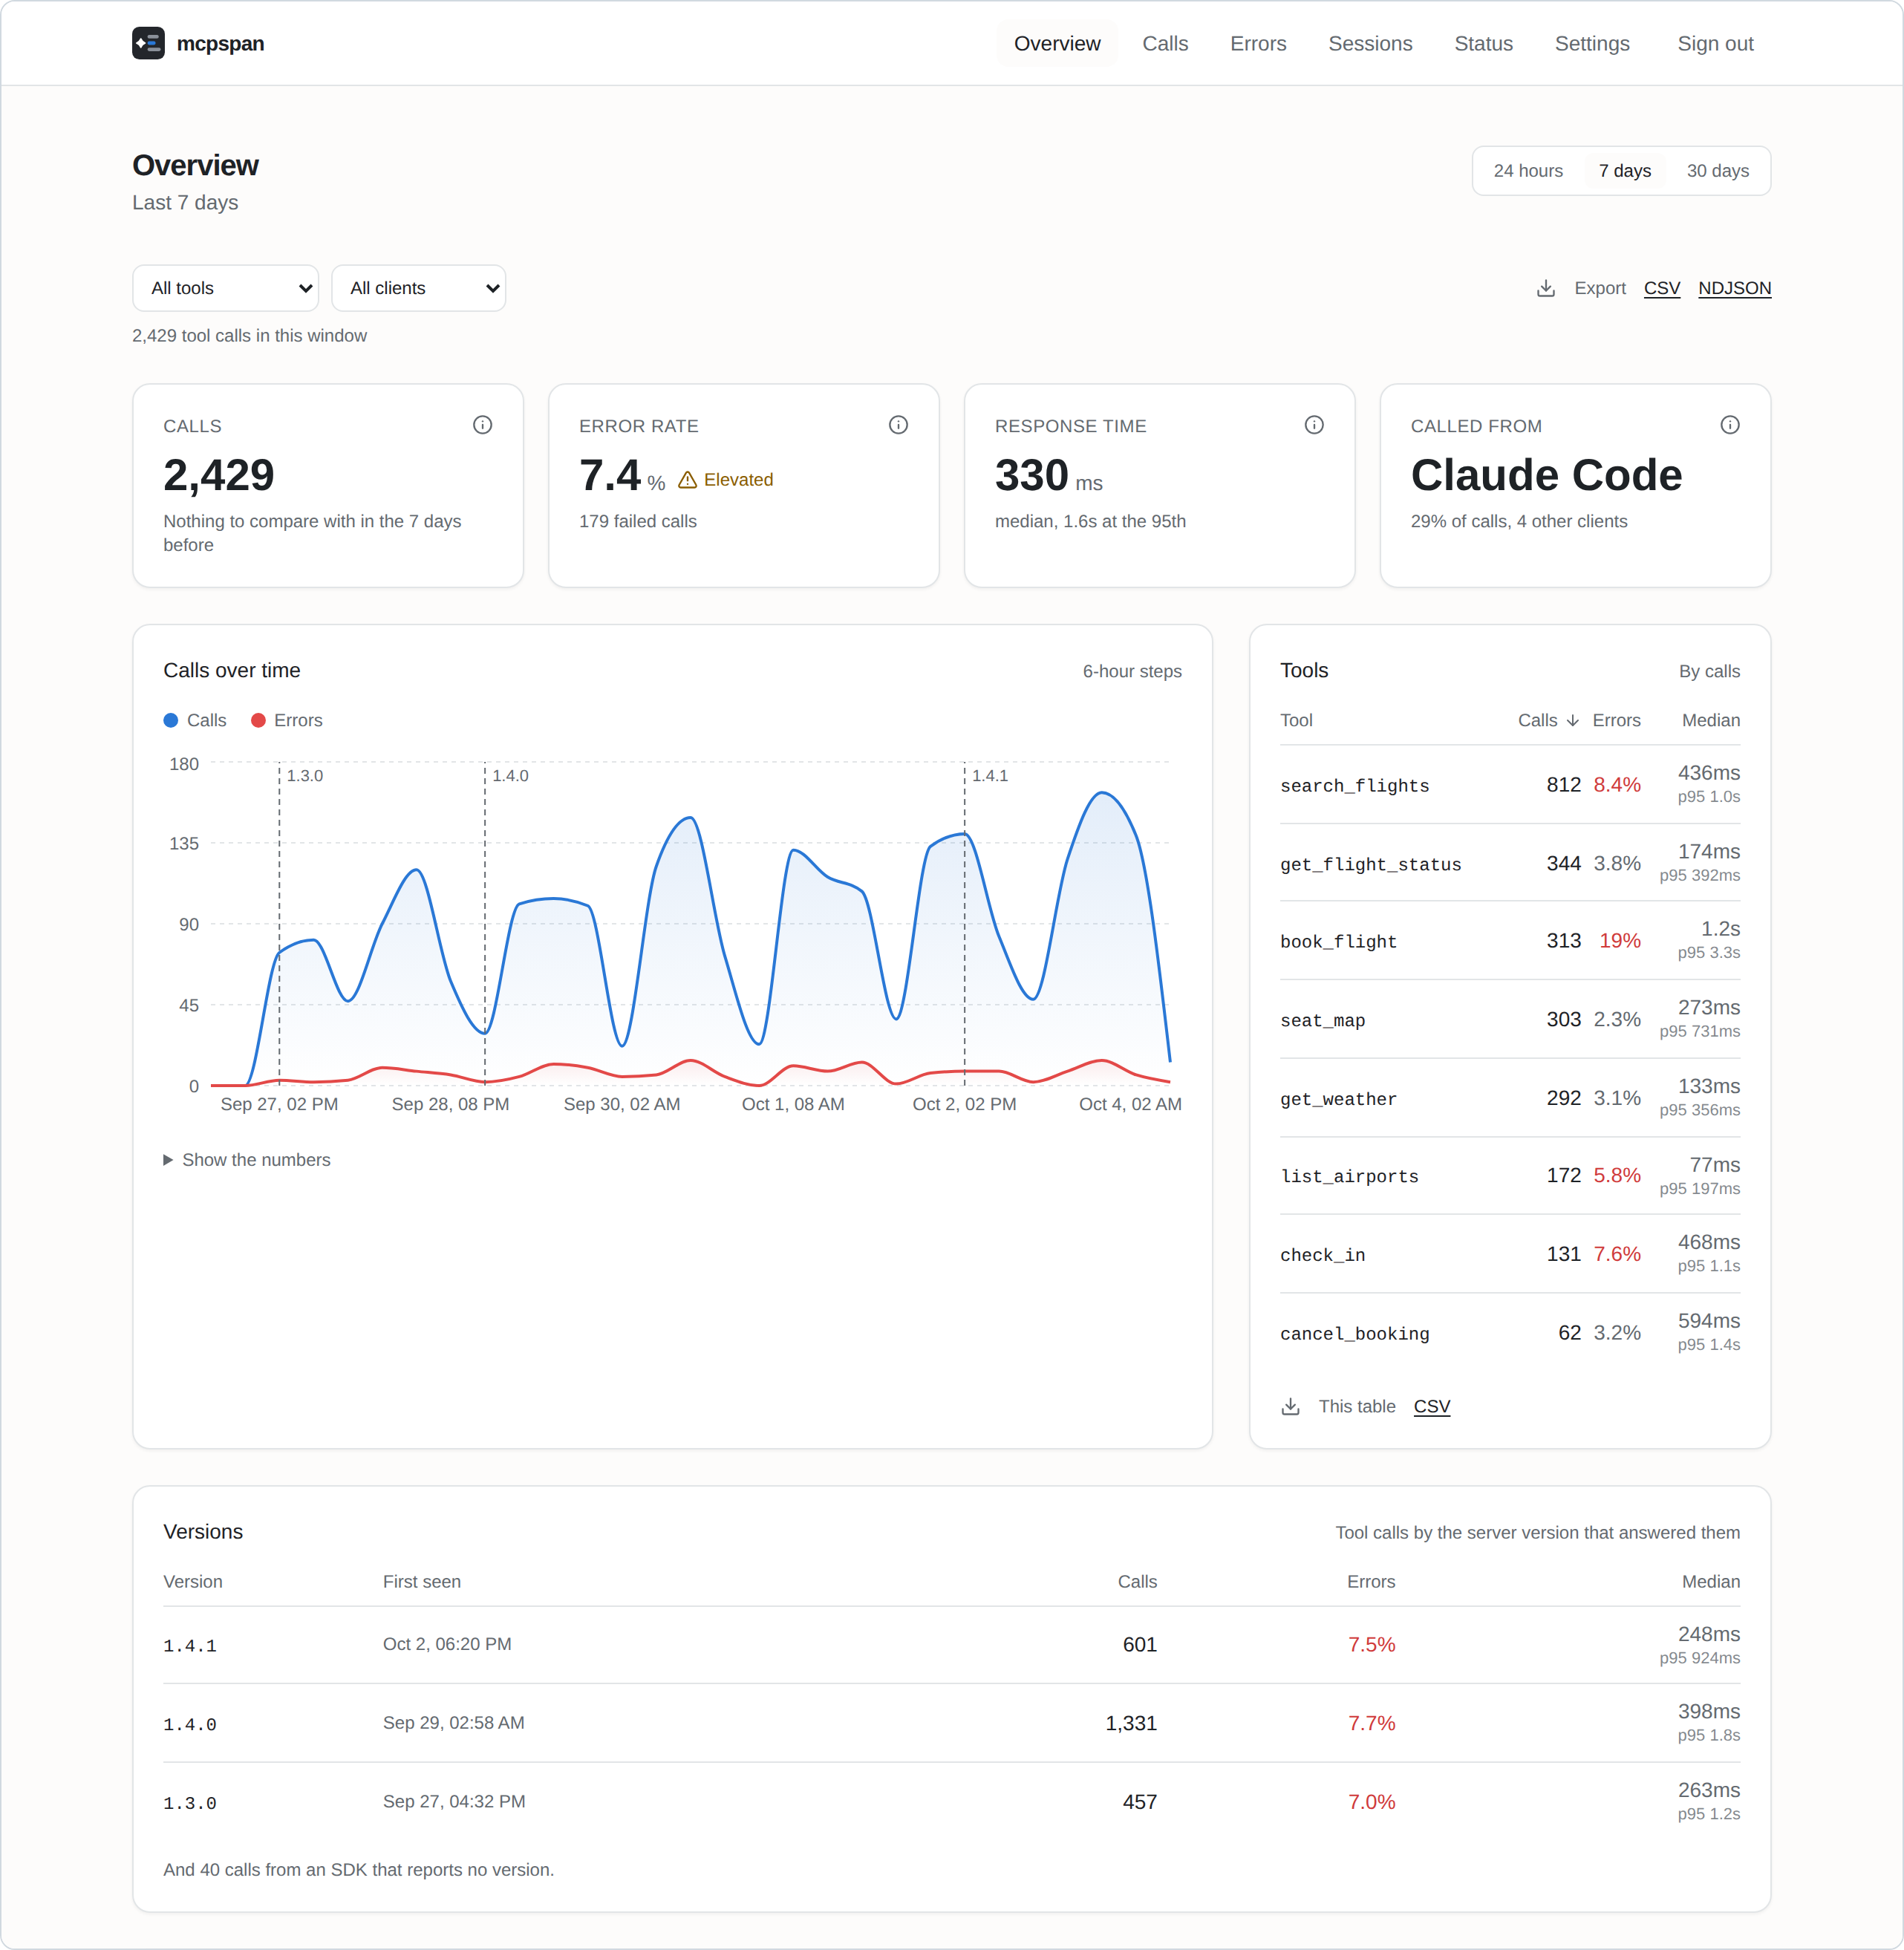
Every call, from every client. Tool calls, resource reads and prompt
gets, with the client that made them: Claude, Claude Code, Cursor, VS Code,
Codex, ChatGPT and the rest.
Response times that mean something. Median and 95th percentile per tool,
and the full distribution, so a cache hit and a slow path do not hide
inside one average.
Answer sizes. How large each tool's answers are, typical and largest:
a tool that now and then returns megabytes fills the agent's context while
looking fine on every latency chart.
What agents are shown. Every session starts by reading the definitions
of all your tools, called or not. See how many tokens that list costs, and
which tools agents were shown in hundreds of sessions and never called.
Failures, told apart. A handler that threw, a tool that answered with an
error, arguments the server refused and which of them were wrong, and tools
that agents asked for but your server does not have: which clients asked,
the closest name you do have, and what the agent did next.
Sessions. Each connection's calls, step by step, as the agent made them,
with the calls an agent repeated with the same arguments marked: a loop
that looks fine one call at a time. A tool's page says which call came
right before it repeated or failed, by client.
Releases. Every call carries the version of your server that answered
it; the charts mark where each release began and compare it with the one
before. A tool's own chart also marks where its description or input schema
changed, since rewording a description can change how agents use a tool
more than a change to its code.
Alerts to Slack, Discord or any webhook, when errors climb or a server
goes quiet, for a whole server or one tool.
Your data, yours to take. CSV and NDJSON exports of anything you can
see, and forwarding to OpenTelemetry for Grafana, Datadog, Honeycomb and the
like.
Private by design. Parameter values never leave your server's process,
and nothing is sent anywhere you did not set up yourself. Error messages,
which a tool that runs commands can fill with anything, can be turned off.
Ask your agent
Claude, Claude Code, Cursor, ChatGPT or any other MCP client can answer from
your mcpspan numbers: which tools failed most this week, and why?, how does
1.4.1 compare with 1.4.0? The API is an MCP server itself: add
http://localhost:6271/mcp to your agent, sign in when it asks, and allow it.
It only reads. Other ways in are on
the MCP server's page.
Badges
Show in your server's README how much it is used and how well it answers:
Calls, success rate and median response time over the last week, switched on
per server in Settings. How they work.
Lint your tool definitions
Before you ship, check what makes a client refuse a tool or an agent pick the
wrong one. No account needed:
git clone https://github.com/mcpspan/mcpspan.git
cd mcpspan
docker compose up -d
Open http://localhost:6270 and create your account. You get an API key
for your first server, and the Settings page shows the line to add to it, in
its language.
Connect your MCP server
TypeScript, on the official MCP SDK:
npm install mcpspan
import { instrument } from 'mcpspan';

instrument(server, {
  apiKey: process.env.MCPSPAN_API_KEY,
  endpoint: 'http://localhost:6271', // your mcpspan installation
});
Register your tools as you always have: every one is measured, and each
returns and fails exactly as it did before.
Settings are optional: copy .env.example to .env to change ports, how long
data is kept, or the address your MCP servers reach the API at.
docs/self-hosting.md covers the rest: the account and
password reset, several servers, settings, exports, OpenTelemetry, and
backups.