
Dev-Suite
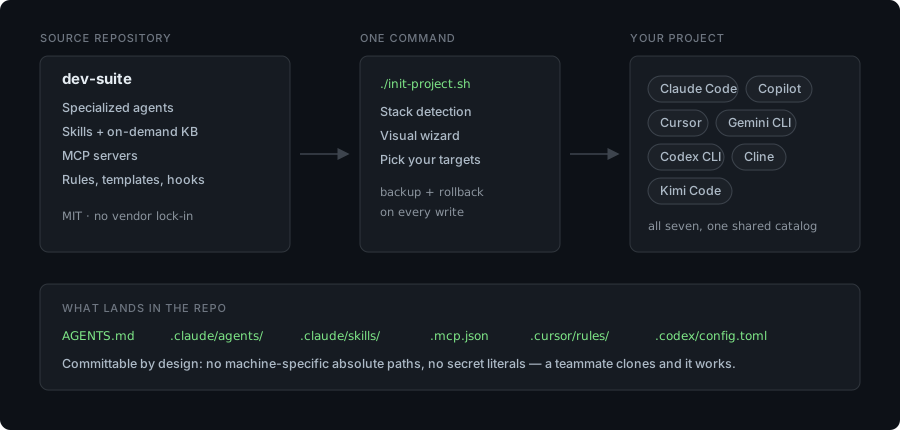
Point it at a repo and it configures your AI coding assistant for that stack — specialized agents, framework skills with an on-demand knowledge base, MCP servers, and path-scoped rules. One install, seven assistants: Claude Code, GitHub Copilot, Cursor, Gemini CLI, Codex CLI, Cline, Kimi Code.
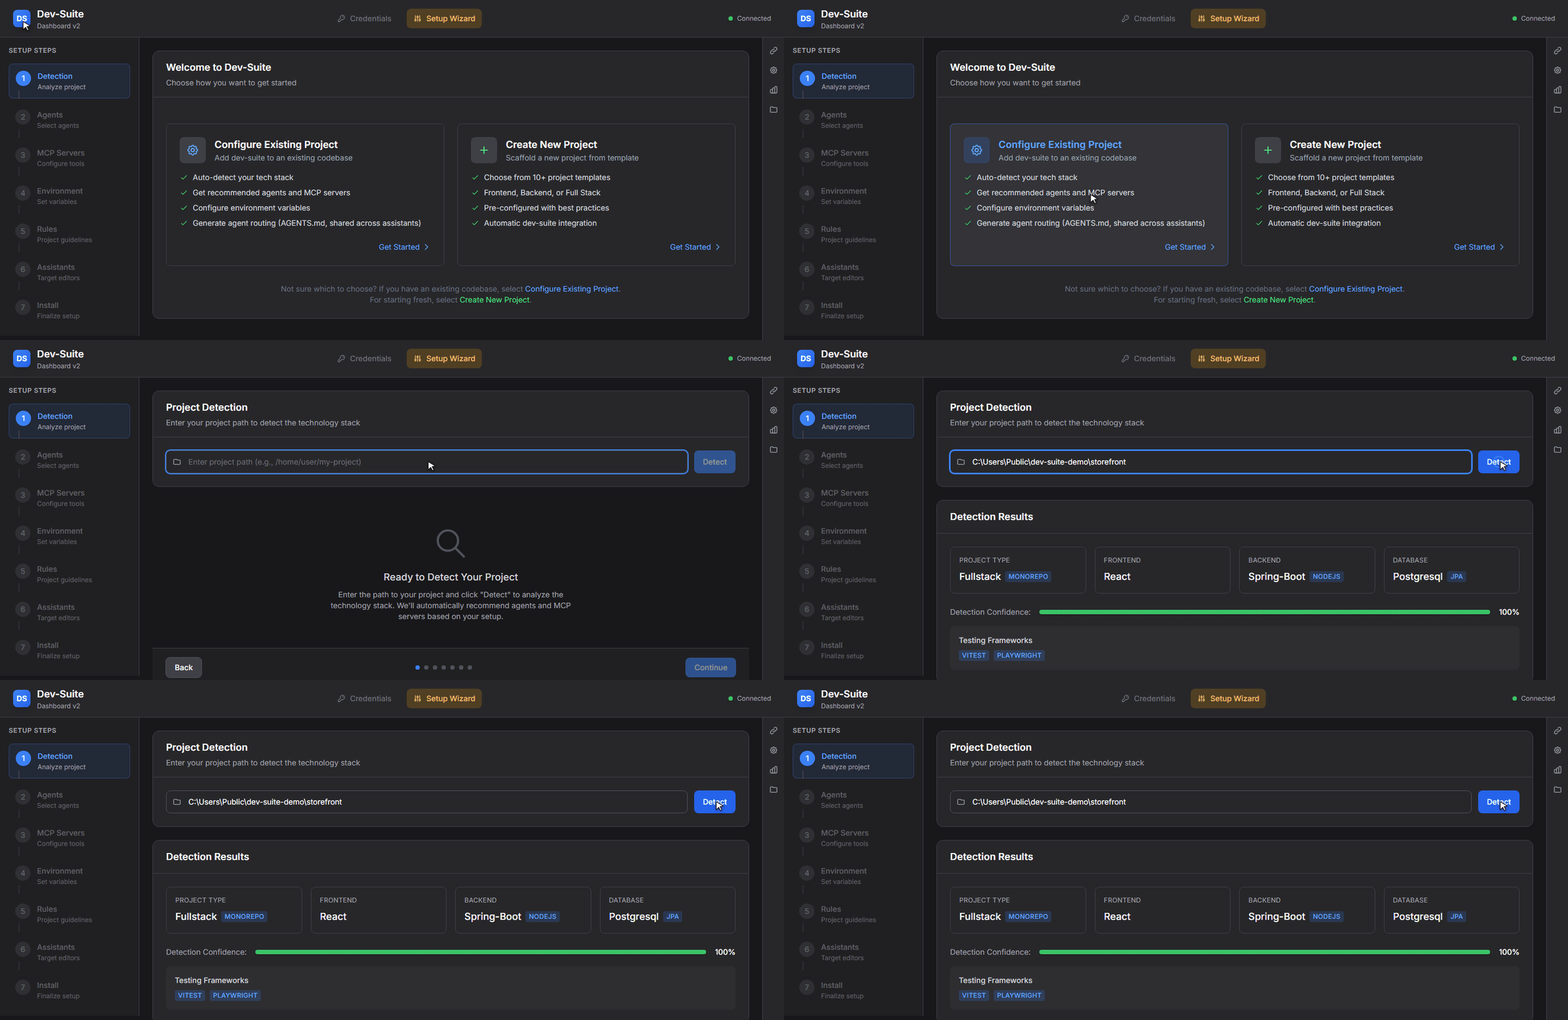
Pointed at a monorepo it has never seen. No questionnaire — it reads the manifests.
The full toolkit, as a desktop app — agents, MCP servers, path-scoped rules and the configurator that picks what your stack actually needs. Download, open it, point it at a repo:
Needs Node.js 20+ on your PATH — the MCP servers run on it. The installers are
not code-signed yet, so the first launch shows an OS warning: what to click.
Just the skills, into whichever assistants you already have — no install at all:
npx skills add claude-dev-suite/claude-dev-suite
From source, if you want to hack on it:
git clone https://github.com/claude-dev-suite/claude-dev-suite.git
cd claude-dev-suite
./init-project.sh /path/to/your-project   # Windows: .\init-project.ps1 C:\path\to\your-project
The wizard detects your stack, you pick the components and the target assistants, and everything it writes is committable: no machine-specific absolute paths, no secret literals, a backup before every overwrite. Your teammate clones the repo and has the same setup.
New here and want to contribute? Start with
good first issue— adding a skill or a quick-ref guide takes about 20 minutes and needs no knowledge of the dashboard internals. See CONTRIBUTING.md.
Table of Contents
- What is Dev-Suite?
- Prerequisites
- Quick Start
- Key Features
- Installation Modes
- Usage
- Configuration
- MCP Servers Reference
- Agents Reference
- Commands Reference
- Upgrading
- Troubleshooting
- Contributing
- License
What is Dev-Suite?
Dev-Suite transforms Claude Code into a full-stack development powerhouse by providing:
- Specialized Agents - Domain experts for React, Angular, Vue, Svelte, Next.js, Electron, Tauri, Spring Boot, ASP.NET Core, Python, FastAPI, Rust (with arti/rustls/rusqlite/rust_decimal/proptest/rust-supply-chain ecosystem), Go, Deno, modern C++ (C++17/20/23), Windows kernel & driver development (WDF/KMDF/UMDF, HID, IDD), data engineering, RAG (retrieval-augmented generation), industrial automation (DCS/PLC), testing (Vitest/Playwright/pytest/Testcontainers/Maestro/Kotest/Turbine/Paparazzi/Roborazzi/proptest), security, DevOps, cloud (AWS/Azure/GCP), mobile (React Native/Flutter, Kotlin Multiplatform + Compose Multiplatform, native Android with Jetpack Compose + Keystore/Biometric, native iOS with SwiftUI + Keychain/Secure Enclave, Rust ↔ Kotlin/Swift via UniFFI, Java Foreign Memory API + jextract for desktop OS keyring), encrypted storage (SQLCipher, libsodium, age), build & supply chain (Gradle KMP, cargo-ndk, cargo-deny/audit/nextest, Sigstore/Cosign keyless signing, OSV-Scanner, reproducible builds), code quality (detekt, ktlint, Compose Rules), observability (Rust tracing + OpenTelemetry, self-hosted Sentry/GlitchTip), documentation (mdBook + rustdoc + Dokka + Showkase), game development (Unity 2D/3D, URP, Cinemachine, DOTS, Netcode, XR), messaging, creative frontend (Framer Motion, GSAP, Three.js, WebGL), and more
- MCP Servers - Extend Claude with tools for documentation (with KB discovery via
list_docs), databases, Docker, API testing, logs, performance profiling, security scanning, and more - Skills - Framework-specific knowledge bases with quick-reference guides, covering frontend, backend, databases, testing, infrastructure, messaging, industrial automation, AI/RAG integration, embeddings, vector stores, document processing, animation, 3D graphics, and more
- Web Dashboard & Electron App - Visual project configuration with stack detection and component selection
- Project Templates - Scaffolding for React, Next.js, Spring Boot, FastAPI, NestJS, Unity 2D, and more
- Task Orchestrator - Submit complex multi-agent tasks from the GUI with real-time streaming updates
- Custom Agents Builder - Create and edit custom agents directly from the dashboard
- Recipes & Automations - Pre-built automation workflows for common development tasks
- Hooks Management - Configure Git hooks and Claude Code hooks from the dashboard
- Multi-Assistant Output - Generate configuration for Claude Code, GitHub Copilot, Cursor, Gemini CLI, Codex CLI, Cline, and Kimi Code from a single install; agents and skills are shared, so several assistants coexist in one project
- Update System - Version visibility (installed vs. available) plus a transactional Reinstall / Sync that re-aligns a project to the current source
- Analytics Dashboard - Track knowledge base usage and correlate with executed jobs
- Broad Technology Coverage - On-demand documentation via a Git-based knowledge base
Key Principle: Dev-Suite is a source repository that initializes your projects. It lives alongside your projects and provides centralized resources that multiple projects can reference.
Multi-Assistant Support
Dev-Suite began as a Claude Code toolkit and still treats Claude Code as its home, but a single install can now generate configuration for Claude Code, GitHub Copilot, Cursor, Gemini CLI, Codex CLI, Cline, and Kimi Code. Pick the targets in the wizard's Target Assistants step (detected assistants are pre-selected).
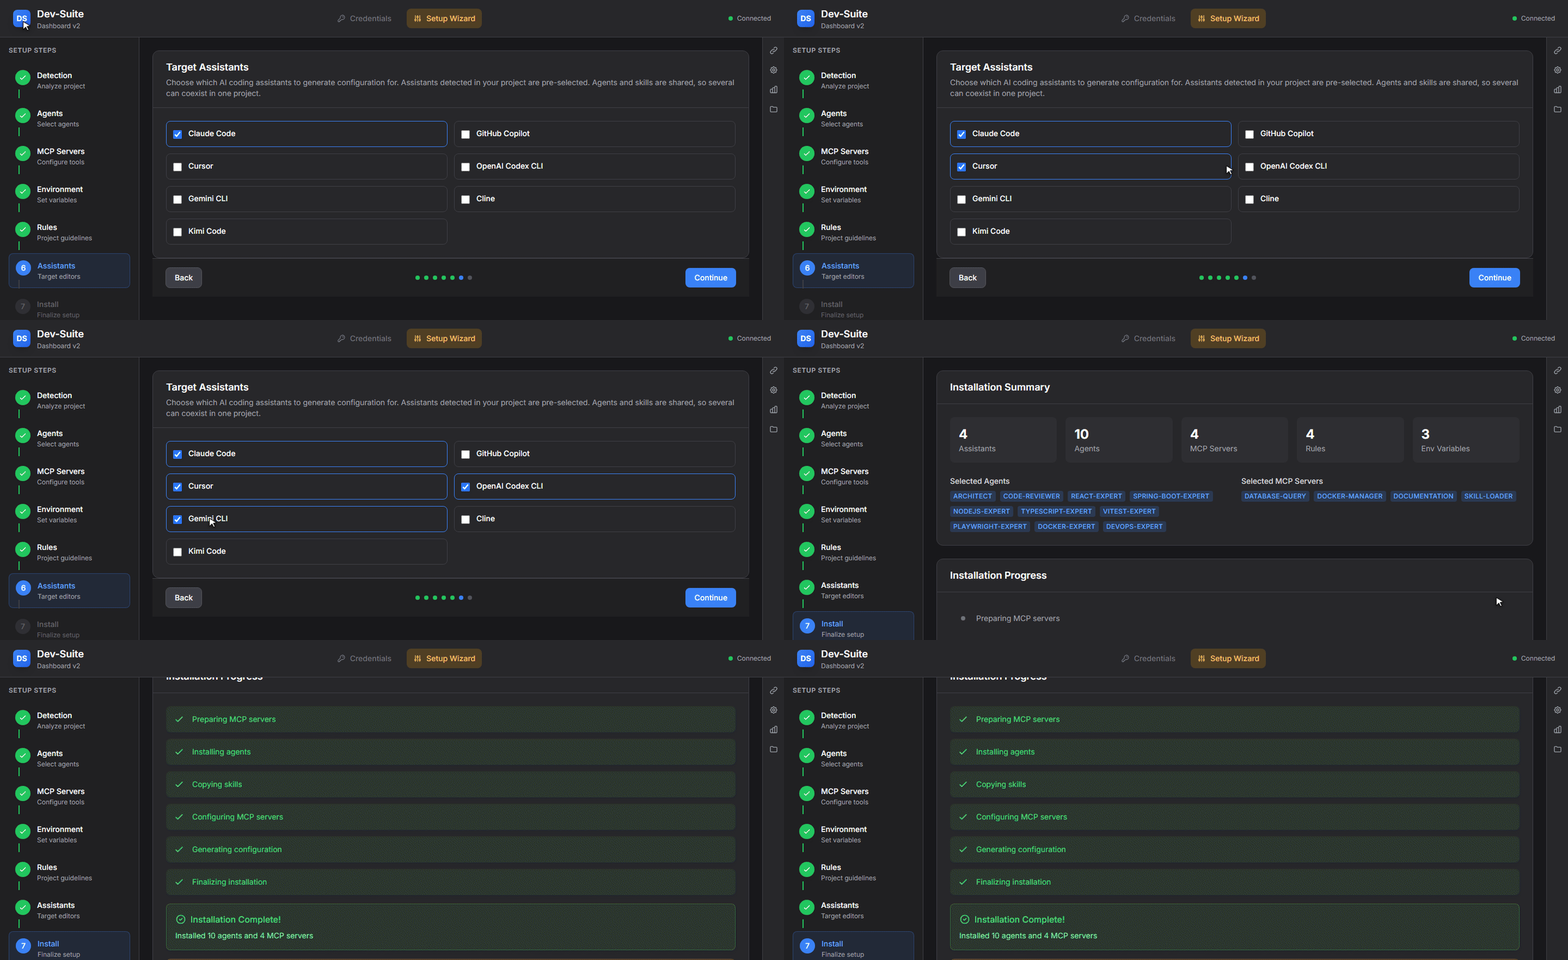
That run wrote all of this into the project, from one catalog:
AGENTS.md                 routing, read natively by Copilot, Cursor, Codex, Gemini, Cline, Kimi
CLAUDE.md                 a pointer that imports AGENTS.md — written only for Claude Code
.claude/                  agents + skills, shared infrastructure (71 files)
.agents/skills/           the same skills, mirrored where Codex and Gemini look (41 files)
.mcp.json                 Claude Code
.cursor/                  mcp.json + rules/                                     (5 files)
.codex/config.toml        [mcp_servers.*], merged into any existing TOML
.gemini/                  settings.json + native subagents                     (11 files)
.mcp-servers/             the server bundles themselves
.dev-suite-manifest.json  every written file, with its hash and target
The installer also reports what each assistant cannot do rather than papering over it — Cursor has no equivalent to rule templates, Codex only loads project MCP config in a trusted folder, Gemini has no project-level rule mechanism. Those gaps are printed at the end of the install, not buried.
How it works:
AGENTS.mdis the primary instructions file — the cross-assistant standard that Copilot, Cursor and others read natively.CLAUDE.mdis generated only when Claude Code is a target, as a thin pointer that importsAGENTS.md..claude/agents/and.claude/skills/are shared infrastructure. Copilot and Cursor read them directly, so agents and skills are written once and available to every selected assistant.- MCP config, path-scoped rules and rule templates are the formats that differ per assistant, and are written in each one's own shape —
.vscode/mcp.json+.github/mcp.json+.github/instructions/for Copilot,.cursor/mcp.json+.cursor/rules/for Cursor,.mcp.json+.claude/rules/for Claude Code. Rule templates follow the same principle:.claude/rules/<id>.mdfor Claude Code, an always-applied.cursor/rules/<id>.mdc(alwaysApply: true) for Cursor, and.github/instructions/<id>.instructions.md(applyTo: "**") for Copilot. An MCP file that already exists is merged rather than replaced: dev-suite rewrites only its own server entries and leaves yours untouched. If the file cannot be parsed it is left alone entirely and reported as a skipped capability.
Codex, Gemini and Kimi Code get AGENTS.md and the full skill set (mirrored to the cross-tool .agents/skills directory they read), plus MCP config in their own format — Gemini's .gemini/settings.json, Codex's .codex/config.toml, Kimi's .kimi-code/mcp.json — and native subagent files for Gemini (.gemini/agents/) and Kimi (.kimi-code/agents/). Cline reads AGENTS.md and the .claude/skills substrate directly and gets path-scoped rules in .clinerules/; it has no committable MCP config, so the install skips it rather than papering over it.
Assistants without a glob mechanism (Codex, Gemini, Kimi) carry agent routing in AGENTS.md instead of path-scoped rules. The Task Orchestrator and dashboard chat remain Claude-only — they run on the Claude Agent SDK. Devin is planned; it is detected and surfaced in the wizard, but not yet configurable.
Prerequisites
- Node.js v20+ - Required to build MCP servers and run the dashboard
- npm - Comes with Node.js
- Git - Required for cloning dev-suite and the knowledge base
- Claude Code - The Anthropic CLI tool that dev-suite extends
Optional:
- Docker - Required if using the docker-manager MCP server
- Database - Required if using the database-query MCP server (PostgreSQL, MySQL, etc.)
Quick Start
Prefer a one-click installer? Skip the clone step and jump to Desktop App Downloads for Windows / macOS / Linux pre-built installers.
Only want the framework skills?
npx skills add claude-dev-suite/claude-dev-suiteinstalls them into the assistants already on your machine — no clone and no build, but also no agents, no MCP servers and no configurator. The steps below are the full toolkit.
1. Clone Dev-Suite
git clone https://github.com/claude-dev-suite/claude-dev-suite.git
cd claude-dev-suite
2. Initialize Your Project
# Launch interactive web dashboard
./init-project.sh /path/to/your-project

# Windows PowerShell
.\init-project.ps1 C:\path\to\your-project
The script will:
- Check Node.js installation (v20+)
- Build the MCP servers, the dashboard server and the UI if they have never been built
- Launch the web dashboard at
http://localhost:3456(first free port from 3456) - Guide you through a 7-step wizard to configure your project
3. Restart Claude Code
Once initialization completes, restart Claude Code to load the new MCP servers and agents.
4. Start Using Dev-Suite
After restarting Claude Code, everything works automatically:
- Agents are routed based on your prompts (e.g., asking about React triggers the
react-expert) - MCP tools are available as Claude Code tools (e.g.,
fetch_docs,execute_query) - Skills provide context-specific knowledge to agents
- Slash commands are available (e.g.,
/docs react hooks)
Key Features
Web Dashboard & Orchestrator
The Web Dashboard (launched via init-project.sh) provides:
Visual Configuration Wizard
- Auto-Detection: Scans
package.json,pom.xml,build.gradle.kts,Cargo.toml,docker-compose.yml,AndroidManifest.xml,libs.versions.toml,ProjectSettings/ProjectVersion.txt,Packages/manifest.json, etc. - Stack Detection: Identifies React, Spring Boot, Android/Kotlin (Room, Compose), Unity (2D, URP, HDRP, DOTS, Netcode, XR, Addressables, Cinemachine, Input System), PostgreSQL, Git provider, and more
- Agent Selection: Pre-selects agents based on detected technologies
- MCP Selection: Pre-selects MCP servers with environment variable configuration
- Target Assistants: Choose which assistants to configure (Claude Code, GitHub Copilot, Cursor, Gemini CLI, Codex CLI, Cline, Kimi Code); detected ones are pre-selected
- One-Click Install: Generates all config files — shared
AGENTS.md+.claude/agents/skills, plus each selected assistant's own MCP config and rules
Task Orchestrator 🔥 NEW
Submit complex multi-agent tasks directly from the GUI:
Dashboard GUI → Submit Task → Claude Code (via MCP) → Execute → Stream Results → Dashboard
Features:
- Real-time streaming via WebSocket (port 3457)
- Interactive input support (y/n confirmations, file selections)
- Job queue management with status tracking
- Live output updates as agents execute
- Result recap with agent outputs, files changed, test results, build status
How to use:
- Open dashboard:
./init-project.sh .or via MCP tooldashboard_open - Navigate to Orchestrator tab
- Enter task description (e.g., "Add user authentication with JWT")
- Submit → Claude Code polls for task → Executes agents → Streams results back
- View recap with links to changed files
Analytics Dashboard 📊 NEW
Track development activity and knowledge base usage:
- KB Usage Statistics: Most-accessed technologies, topics, search queries
- Agent Performance: Execution counts, average duration
- Technology Trends: Correlate KB queries with orchestrator jobs
- Timeline View: Hourly/daily usage patterns
Access at: http://localhost:3456/analytics (when dashboard is running)
Code Generator NEW
Spec-driven code generation with AI refinement:
Dashboard → Upload Spec → Deterministic Generation → AI Refinement → Accept/Reject
Supported formats: OpenAPI (JSON/YAML), AsyncAPI, TypeSpec, Protobuf, BPMN
Features:
- 9 target languages/frameworks: TypeScript (Express, Fastify, NestJS, Koa), Java (Spring), Python (FastAPI, Flask), Go (Gin, Echo)
- Convention-aware: Reads
.prettierrc,tsconfig.json, ESLint config to match project style - AI refinement: Uses specialized agents + refinement skill for naming, imports, and code quality
- 5-step wizard: Technology → Upload Spec → Configure → Preview → Generate
- File browser: Preview generated code before accepting
How to use:
- Open dashboard and navigate to Code Generator tab
- Select spec technology (OpenAPI, AsyncAPI, etc.)
- Upload your spec file (drag-and-drop supported)
- Choose target language, framework, and output directory
- Preview → Generate → Optionally refine with Claude
File Viewer
Browse and inspect your project files directly from the dashboard:
- File tree navigation - Collapsible directory tree with smart filtering (skips
node_modules,dist,.git, etc.) - Syntax highlighting - VS Code-quality highlighting via shiki for TypeScript, Python, Rust, Go, Java, JSON, YAML, Markdown, and 50+ languages
- Read-only safety - View any file up to 500 KB without risk of accidental edits
- Path breadcrumb - Always shows the full path of the open file
Access from the Files tab in the right tool window bar.
MCP Servers
Specialized MCP servers extend Claude Code with powerful tools:
See MCP Servers Reference for detailed documentation.
Specialized Agents
Domain experts with deep knowledge in specific technologies. Dev-suite ships agents for frontend and backend frameworks, databases, testing, DevOps and cloud, mobile (including Kotlin Multiplatform and native Android/iOS), data engineering and RAG, security, game development, industrial automation (DCS/PLC), Bitcoin and Lightning, and Claude Code extension authoring.
Each agent declares its own skills, its MCP servers, and the model it runs on. The wizard pre-selects the ones your detected stack needs; nothing is installed that you did not pick.
See the Agents Reference below for the full list with models and MCP servers, or docs/AGENT-CAPABILITY-MATRIX.md for per-agent skills. Both are generated from agent frontmatter, so they cannot drift.
Skills & Knowledge Base
Skills organized by category:
- Frontend: React, Vue, Angular, Svelte, Next.js, Nuxt, TailwindCSS, shadcn/ui
- UX/Design: Visual hierarchy, design tokens (W3C spec), interaction design, motion, loading states, mobile UX, color systems, ethical design
- Animation: Framer Motion, GSAP (scroll-driven, timelines, morphing), CSS advanced effects (clip-path, masks, CSS Houdini, scroll-driven animations)
- Graphics & 3D: Three.js/React Three Fiber, SVG animation, Canvas/WebGL, generative art, particle systems
- Backend: Spring Boot, NestJS, Express, FastAPI, ASP.NET Core, Rust, Go, Deno frameworks
- Databases: PostgreSQL, MySQL, MongoDB, Redis
- ORM/ODM: Prisma, Drizzle, TypeORM, SQLAlchemy, Spring Data JPA
- Testing: Vitest, Jest, Playwright, Cypress, Testcontainers (Java), testcontainers-python, pytest, pytest-django, FastAPI testing, factory_boy, Celery testing, Pact (contract testing), Messaging Testing (Kafka, RabbitMQ, multi-broker)
- State Management: TanStack Query/Router, Redux Toolkit, Zustand, Pinia
- API Design: REST, GraphQL, tRPC, OpenAPI
- Infrastructure: Docker, Kubernetes, GitHub Actions
- Security: JWT, OAuth2, NextAuth, OWASP
- Best Practices: Git Workflow, Clean Code, Performance Optimization
- Code Review: Per-language review skills — the defects a language's compiler and linters do not report, plus what they already cover, so a review does not repeat the toolchain
Knowledge Base Architecture
The knowledge base provides on-demand documentation via a separate Git repository: github.com/claude-dev-suite/knowledge_base
How it works:
Agent needs docs → documentation MCP → Git sparse checkout → Cache (2h TTL) → Return to agent
- An agent (or you) requests documentation via
fetch_docs({ technology: "react", topic: "hooks" }) - The documentation MCP server checks the local cache (
.kb-cache/) - If cached and fresh (< 2 hours), it returns the cached content immediately
- If not cached or stale, it performs a Git sparse checkout to fetch only the requested files from the KB repository
- The content is cached locally for subsequent requests
The three-layer knowledge system:
┌─────────────────────────────────────────────┐
│  Layer 1: Skills (.claude/skills/)          │  Always loaded in agent context
│  Quick-reference guides, patterns, rules    │  Instant access, no network needed
├─────────────────────────────────────────────┤
│  Layer 2: Quick-Refs (skills/*/quick-ref/)  │  Detailed guides per topic
│  Each references KB docs for deep dives     │  Loaded on demand by agent
├─────────────────────────────────────────────┤
│  Layer 3: Knowledge Base (Git repo)         │  Full documentation
│  Fetched on demand via the MCP server       │  Cached for 2 hours
└─────────────────────────────────────────────┘
- Layer 1 (Skills): Concise rules and patterns loaded directly into the agent context. No network required.
- Layer 2 (Quick-Refs): More detailed guides within skill folders. Each quick-ref links to KB docs for full documentation.
- Layer 3 (Knowledge Base): Complete documentation stored in a separate Git repository, fetched on-demand by the documentation MCP server with local caching.
Configuration:
# Optional: use a custom KB repository (defaults to official repo)
KB_REPO_URL=https://github.com/claude-dev-suite/knowledge_base.git

# Optional: cache TTL in seconds (default: 7200 = 2 hours)
KB_CACHE_TTL=7200
Adding documentation to the KB:
- Clone the KB repository:
git clone https://github.com/claude-dev-suite/knowledge_base.git - Add markdown files under
knowledge/{technology}/{topic}.md - Update the relevant category file in
mcp-servers/documentation/src/docs-index/(e.g.,testing.ts,backend.ts) to register the new technology —docs-index.tsis a re-export aggregator, do not edit it directly - Commit and push - the documentation MCP server will fetch new docs automatically on next request
Project Templates
Ready-to-use scaffolding templates for quick project setup:
Templates are used during the initialization wizard (Step 0) and provide pre-configured project structure, dependencies, and dev-suite integration.
Custom Agents Builder
Create and manage custom agents directly from the dashboard:
- Visual Editor - Write agent markdown with YAML frontmatter
- Skill Association - Link agents to specific skills and MCP servers
- Instant Deployment - Agents are saved to
.claude/agents/and immediately available - Edit & Delete - Manage existing custom agents from the dashboard
Recipes & Automations
Pre-built automation workflows for common development tasks:
- Browse and apply built-in automation recipes
- Recipes combine agent actions, hooks, and tool configurations
- Apply recipes to quickly set up common patterns (testing pipelines, linting, code review flows)
Hooks Management
Configure Git hooks and Claude Code hooks from the dashboard:
- Git Hooks - Pre-commit, pre-push, commit-msg hooks
- Claude Code Hooks - Event-based automation (on file write, on tool call)
- Visual Configuration - Edit hooks through the dashboard UI
- Template Support - Pre-configured hook templates for common workflows
Update System
Keep dev-suite components up to date through the dashboard Updates tab:
- Version Visibility - See the dev-suite version installed in your project alongside the version available from source, with an at-a-glance Up to date / Update available status
- New Component Discovery - Proactively notifies when new agents or MCP servers are added to dev-suite after your installation, with one-click install
- Reinstall / Sync - A single, transactional erase-and-replace that re-aligns a project to the current source: managed components are re-installed and orphaned ones removed, while your custom agents/skills,
CLAUDE.mdnotes, andsettings.jsonkeys are preserved - Per-file opt-out - Locally modified managed files are previewed with an Overwrite / Keep choice
- Safe by default - A backup is taken before any change and any failure rolls back automatically
Electron Desktop App
The dashboard is available as a native desktop application:
- Cross-platform support (Windows, macOS, Linux)
- Fast startup with optimized splash screen
- Auto-updater for seamless version updates
- Native system tray integration
- Same features as the web dashboard
See Desktop App Downloads below for pre-built installers.
Desktop App Downloads
Pre-built installers for every tagged release are published on the GitHub Releases page.
Important prerequisite — install Node.js first. The desktop app launches its own dashboard but does not ship a system-wide Node.js runtime. Claude Code starts MCP servers via the
.mcp.jsonit reads on each project, and those server processes requirenodeto be available on the user'sPATH. Without Node.js v20+ installed system-wide, MCP servers will fail silently. The app shows a warning dialog on first launch if Node is missing — install it from nodejs.org and restart the app.
Each release carries the installers twice: under a versioned name, which the in-app updater uses, and under a fixed name that always resolves to the latest release — the links below.
Installers are currently unsigned. The OS will show a warning on first launch — see the per-platform instructions below.
Windows
- Download
dev-suite-windows-x64-setup.exe. - Double-click to run. SmartScreen will show "Windows protected your PC" because the binary isn't signed yet.
- Click More info → Run anyway.
- The installer will set up the app and add a Start menu shortcut.
macOS
- Download the DMG matching your CPU:
arm64for Apple Silicon,x64for Intel.- Not sure? Click → About This Mac. "Chip: Apple…" = arm64.
- Open the DMG and drag Dev-Suite Dashboard into Applications.
- First launch is blocked by Gatekeeper because the app isn't notarized. Choose one:
- Recommended: Right-click the app in Applications → Open → confirm Open in the dialog. macOS will remember the choice.
- CLI alternative: strip the quarantine flag:
xattr -d com.apple.quarantine "/Applications/Dev-Suite Dashboard.app"
Linux — AppImage (portable, all distros)
chmod +x dev-suite-*.AppImage
./dev-suite-*.AppImage
If the AppImage refuses to run on a system without FUSE 2 (Ubuntu 22.04+, Fedora 38+), install it with sudo apt install libfuse2 or extract and run instead:
./dev-suite-*.AppImage --appimage-extract-and-run
Linux — Debian / Ubuntu / Mint (.deb)
sudo dpkg -i dev-suite-*.deb
sudo apt-get install -f   # only if dpkg reports missing dependencies
Linux — Fedora / RHEL / openSUSE
No native .rpm is published yet — use the AppImage above. It runs on all RPM-based distros without installation.
Auto-updates
The desktop app checks GitHub Releases at startup and every 4 hours. When a new version is published, you'll get an in-app notification and an Install on quit option. Auto-updates work the same on all three platforms.
Code signing policy
Signing of the Windows installer through the SignPath Foundation open-source program is being applied for; until it is approved the installers stay unsigned. Which binaries are signed, who approves each signing request, and what the app sends over the network: docs/CODE-SIGNING-POLICY.md.
Installation Modes
Interactive Mode (Default)
./init-project.sh /path/to/project
Launches web dashboard at http://localhost:3456 with a 7-step wizard:
- Detection - Auto-detect stack, databases, Git provider
- Agents - Select specialized experts (pre-selected based on stack)
- MCP Servers - Select tools (pre-selected based on stack)
- Environment - Configure database URLs, API tokens
- Rules - Pick project rule templates
- Assistants - Choose which AI assistants to configure (detected ones pre-selected)
- Install - Generate config files and copy components
The launcher takes a project path and nothing else; it builds the dashboard on first run.
Headless Reinstall / Sync
The wizard is the only way to do a first install. Re-aligning a project that already has dev-suite installed can run without a UI:
cd configurator/dashboard/server
npm run reinstall -- --project /path/to/project --dry-run
npm run reinstall -- --project /path/to/project --yes
--dry-run prints the plan and exits. --keep <relPath> preserves a locally modified managed
file, --no-backup skips the safety backup, and --json emits a machine-readable report.
Usage
Daily Development with Agents
After initialization, agents work automatically in Claude Code. When you ask questions or give tasks, Claude Code routes them to the appropriate agent based on keywords:
You: "Add a login form with validation"
→ Claude Code activates react-expert (detects React/frontend keywords)
→ Agent uses react skills + documentation MCP for best practices

You: "Why is this SQL query slow?"
→ Claude Code activates sql-expert (detects SQL/query keywords)
→ Agent uses database-query MCP to run EXPLAIN and analyze

You: "Review this PR for security issues"
→ Claude Code activates code-reviewer + security-expert
→ Agents use code-quality and security-scanner MCP tools
Using MCP Tools Directly
MCP tools are available as Claude Code tools. You can ask Claude to use them:
"Fetch the React hooks documentation"
→ fetch_docs({ technology: "react", topic: "hooks" })

"List all Docker containers"
→ docker_ps({ all: true })

"Scan this project for vulnerabilities"
→ scan_all({ path: "." })
Using the Dashboard
The dashboard can be reopened at any time for project management:
# Reopen dashboard for current project
./init-project.sh .

# Or via Claude Code MCP tool
# Ask Claude: "Open the dashboard"
→ dashboard_open()
Dashboard tabs:
- Wizard - Re-run the initialization wizard or use templates
- Manage - Add/remove agents, MCP servers, hooks, custom agents, recipes (with proactive new-component notifications)
- Orchestrator - Submit multi-agent tasks with real-time progress
- Analytics - View knowledge base usage statistics
- Git - Visual git operations (branches, commits, diffs, GitHub CLI auth detection with automatic login prompts)
- Updates - Check for and apply dev-suite updates
Using the Orchestrator
For complex tasks that require multiple agents:
- Open the dashboard (
./init-project.sh .) - Go to the Orchestrator tab
- Describe your task (e.g., "Refactor the auth module and add tests")
- Submit the job
- Claude Code picks up the task, executes agents, and streams results back
- View the recap with changed files, test results, and build status
Using Templates
To scaffold a new project from a template:
- Open the dashboard
- In the wizard, select "Start from Template" mode
- Choose a template (e.g.,
fullstack-nextjs-nestjs) - Configure project-specific options
- The template generates the project structure with dev-suite pre-configured
Configuration
Generated Files
What an install writes depends on which assistants you selected. These are always written:
your-project/
├── AGENTS.md                    # Agent routing (auto-generated, the cross-assistant standard)
├── .dev-suite.json              # Stack and component configuration
├── .dev-suite-manifest.json     # Every file dev-suite wrote, with hashes — drives sync/uninstall
├── .claude/
│   ├── agents/                  # Selected agents (shared substrate: Copilot and Cursor read it too)
│   └── skills/                  # Their skills
└── .mcp-servers/                # Installed MCP servers, built from dev-suite
    ├── documentation/
    ├── database-query/
    └── ...
Then one set per selected assistant:
CLAUDE.md and .mcp.json appear only when Claude Code is one of the targets — they are not
written for a Copilot-only or Cursor-only install. Slash commands are Claude-Code-only: no other
assistant reads .claude/commands.
.dev-suite.json Example
.dev-suite.json records the installed selection — nothing more. The detected stack is
recomputed by the dashboard each run and is deliberately not persisted here.
{
  "version": "1.12.0",
  "installedAt": "2026-08-24T10:00:00.000Z",
  "agents": {
    "enabled": ["architect", "react-expert", "nestjs-expert", "prisma-expert"]
  },
  "mcpServers": {
    "enabled": ["documentation", "database-query", "api-tester"]
  },
  "rules": {
    "enabled": ["conventional-commits", "semver"]
  }
}
For the full record of what was written — every file with its hash and the assistant it
belongs to, plus the catalog snapshot used to detect newly available components — see
.dev-suite-manifest.json.
Environment Variables
Create a .env file in your project root:
# Database
DATABASE_URL=postgresql://user:pass@localhost:5432/dbname

# Optional: Dashboard ports
DASHBOARD_PORT=3456
ORCHESTRATOR_WS_PORT=3457

# Optional: Documentation KB (defaults to official repo)
KB_REPO_URL=https://github.com/claude-dev-suite/knowledge_base.git
KB_CACHE_TTL=7200
Security Note: Never commit .env files. API tokens are only referenced by variable name in .dev-suite.json.
MCP Servers Reference
Documentation Server
Fetch on-demand documentation via the Git-based knowledge base. Call list_docs to see everything indexed.
Tools:
fetch_docs({ technology, topic, source?, refresh? })- Get documentation for a topicsearch_docs({ query, technologies? })- Search across all docslist_topics({ technology })- List available topics for a technologylist_versions({ technology })- List supported versions
Example:
fetch_docs({ technology: "spring-boot", topic: "security" })
Database Query Server
Query, inspect and diagnose PostgreSQL, MySQL/MariaDB and SQLite (MongoDB is not supported). Every connection is read-only unless marked writable; read-only is enforced by the database itself, and each query runs with a timeout and a row cap.
Tools:
list_connections— List configured database connections (engine, read-only flag, host/db, SSL) and which tools each engine supportsexecute_query— Run one read-only SQL statement (engine-enforced read-only txn, timeout, row cap + paging). PG, MySQL, SQLiteexecute_write— Run DML/DDL on a connection marked writable. Dry run (rolled back / EXPLAIN) unless confirm=truelist_schemas— List schemas (Postgres), databases (MySQL) or attached databases (SQLite) with object countslist_tables— List tables, views and materialized views in a schema with row estimates, sizes and commentsdescribe_table— Full table definition: columns, PK, FKs (composite), unique/check constraints, indexes, triggersget_schema— Schema overview of all tables (or one): columns, keys, indexes, enums. compact=true for names onlylist_objects— List enums, types, functions, procedures, triggers, sequences, views, indexes or extensions in a schemasearch_objects— Find tables, views, columns, functions and types whose name contains a patternpreview_table— Sample rows from a table or view (optional columns and ordering), read-only and row-cappedexplain_query— Show a query plan with a summary (full scans, misestimates). analyze=true executes it in a rolled-back txnfind_slow_queries— Top queries by time from pg_stat_statements (Postgres) or performance_schema (MySQL), plus scan statsindex_recommendations— Find unused, duplicate and redundant indexes and foreign keys without a supporting indexhealth_check— Health report: connections, long queries, blocking locks, cache hit, bloat, vacuum/analyze, replicationcompare_schemas— Diff two schemas: tables, columns, types, nullability, defaults, keys, constraints, indexes, enumsgenerate_migration— Generate up/down migration SQL from a schema diff (Postgres first-class; MySQL/SQLite best effort)backup_restore— Backup, list or restore (confirm required) via pg_dump/pg_restore, mysqldump or SQLite VACUUM INTO
Configure one connection with DATABASE_URL, or several named ones with DATABASE_URLS (JSON). Writes need DATABASE_ALLOW_WRITES=true (or a writable entry) and confirm: true; without it execute_write and restore are dry runs.
SQLite uses Node's built-in node:sqlite and needs Node 22.13+. Backups use pg_dump/mysqldump from PATH (or DB_CLIENT_BIN_DIR) and stay inside DB_BACKUP_DIR.
find_slow_queries reads pg_stat_statements on Postgres (and says how to enable it when missing) and performance_schema on MySQL.
Environment variables: DATABASE_URL, DATABASE_URLS, DATABASE_ALLOW_WRITES, DB_STATEMENT_TIMEOUT_MS, DB_MAX_ROWS, DB_BACKUP_DIR, DB_CLIENT_BIN_DIR, DB_ALLOW_PRIVATE_ADHOC_URLS (descriptions and defaults in mcp-servers/database-query/metadata.json; the wizard prompts for them).
Docker Manager Server
Containers, images, Compose projects, networks, volumes and the daemon, through the docker CLI (Podman via DOCKER_CLI). Every call has a timeout and an output cap; inspect output redacts environment values unless revealEnv is set.
Tools:
docker_ps— List containers with filters (status, label, name, image, compose project, network, health)docker_container— Container lifecycle + logs, inspect (env redacted), top, port, diff, wait, health, statsdocker_run— Run or create a container: ports, env, volumes, network, restart, limits, labels, commanddocker_exec— Run a command in a running container (non-interactive; user, workdir, env, timeout, output cap)docker_cp— Copy files between a container and the host (host path confined to allowed roots)docker_compose— Docker Compose on a chosen project (dir, files, name, profiles): up, down, ps, logs, exec, run, config…docker_images— Images: list, pull, remove, inspect, history, tag, push, search, save, loaddocker_build— Build an image (context, Dockerfile, tags, build args, target, platform, no-cache); returns image IDdocker_registry— Registry login (password via stdin, never echoed) and logoutdocker_stats— Show resource usage statistics for containersdocker_networks— Networks: list, inspect, create, remove, connect, disconnect, prune (exact preview)docker_volumes— Volumes: list, inspect, create, remove, prune (exact preview, dry run by default)docker_system— Daemon status, disk usage (df), info, version, bounded event window, contextscleanup_unused— Prune unused resources; dry run (default) lists exactly what would go; volumes need opt-in
Compose commands take projectDir, files, projectName, profiles and envFile. Host paths (bind mounts, build context, docker_cp) must stay inside DOCKER_MCP_ALLOWED_ROOTS (default: the server's working directory).
cleanup_unused and the network/volume prune actions are dry runs by default and preview exactly what the real prune would delete; deleting volumes needs includeVolumes: true.
Environment variables: DOCKER_HOST, DOCKER_CONTEXT, DOCKER_CLI, DOCKER_MCP_ALLOWED_ROOTS, DOCKER_MCP_TIMEOUT_MS, DOCKER_MCP_LONG_TIMEOUT_MS, DOCKER_MCP_MAX_OUTPUT_BYTES (descriptions and defaults in mcp-servers/docker-manager/metadata.json; the wizard prompts for them).
API Tester Server
Send and assert HTTP requests, run multi-step scenarios, validate a live API against its OpenAPI contract, mock an API from its spec, and talk GraphQL, WebSocket and SSE.
Tools:
http_request— Send an HTTP request (any body type, auth, env vars, cookies, TLS/proxy) and assert on the responsehealth_check— Probe common health endpoints (or given paths) of a base URL and report status and latencybatch_request— Run many requests in parallel or in sequence, each with optional assertionsimport_collection— Import Postman, Insomnia, Bruno, .http/.rest, HAR or OpenAPI into runnable requests and variablesexport_collection— Export requests (or any importable source) as a Postman v2.1 collection or a .http filegenerate_tests— Generate positive/negative tests with schema checks from OpenAPI 2/3.x as Vitest, Jest, pytest, .http or scenariomock_server— Start/stop/list OpenAPI mock servers with request validation, examples, Prefer codes, latency, logsvalidate_contract— Call spec operations on a live API and check status, content type and body schema against OpenAPIenvironment— Manage named environments of {{variables}} stored in the project; secret values are never shownsession— List or clear cookie-jar sessions and the cached OAuth2 tokensrun_scenario— Run ordered request steps with assertions, value extraction into variables and a per-step reportgraphql_request— Run a GraphQL query/mutation with variables, or introspect the schema (summary or SDL)websocket— WebSocket client: connect, send, receive buffered messages, close, or a one-shot exchangesse_listen— Open a Server-Sent Events stream and collect events for a duration or up to a countload_test— Short bounded load test (concurrency or RPS, max 60 s) reporting p50/p95/p99 and error rate
Auth helpers: bearer, basic, API key, digest and OAuth2 (client credentials, password) with token caching; cookie sessions; environments with {{variables}} stored in .api-tester/ (secret values in a gitignored file, never echoed).
Imports Postman, Insomnia (v4/v5), Bruno, .http/.rest, HAR and OpenAPI 2/3.x. Loopback targets are allowed; other private networks need API_TESTER_ALLOW_PRIVATE=1. Cloud metadata addresses are always blocked, including at connect time.
Environment variables: API_TESTER_ALLOW_PRIVATE, API_TESTER_PROJECT_DIR, CLAUDE_PROJECT_DIR, API_TESTER_PROXY (descriptions and defaults in mcp-servers/api-tester/metadata.json; the wizard prompts for them).
API Explorer Server
Explore, lint and diff API descriptions: OpenAPI 2.0/3.0/3.1, GraphQL, AsyncAPI 2/3 and gRPC .proto, loaded from URLs, project files or a git revision.
Tools:
list_api_endpoints— List registered API sources (alias, location, kind, origin). Same as list_api_sources; kept for compatibility.list_api_sources— List registered API sources (env + runtime) with alias, location, kind, and any config errorsadd_api_source— Register a spec at runtime: URL or project file (OpenAPI/Swagger, AsyncAPI, GraphQL SDL/endpoint, .proto)remove_api_source— Unregister an API source by alias for the rest of this sessionget_api_schema— Get a source's full document (size-capped) or a summary: version, servers, tags, counts, webhookslist_api_paths— List OpenAPI operations and webhooks, filtered by tag/method/prefix, paginatedget_api_endpoint_details— Operation details: params, bodies per media type, responses, headers, security, servers, callbacks; refs resolvedmatch_api_operation— Match a concrete URL and method (GET /users/42) to its OpenAPI operation (/users/{id}) with path paramsget_api_models— List or get schema models (components.schemas / definitions) with usage, optional $ref resolution and examplesget_api_security— Security schemes, global requirements, operations per scheme and unauthenticated operationssearch_api— Ranked search across sources: operations, models, tags, GraphQL fields/types, channels, messages, rpcslint_api_spec— Lint an OpenAPI spec with a Spectral-style ruleset (operationIds, path params, refs, unused components...)diff_api_specs— Diff two OpenAPI specs (alias, file, URL or git ref) and classify changes as breaking/non-breaking/infogenerate_api_request— Generate curl, HTTPie, fetch and Python requests snippets plus a sample body for an operationlist_graphql_operations— List GraphQL queries, mutations and subscriptions with arguments and return typeslist_graphql_types— List GraphQL types, optionally filtered by kind (object, interface, union, enum, input, scalar)get_graphql_type— Get a GraphQL type: fields with args, interfaces, implementations, enum values, input fields and SDLlist_asyncapi_channels— List AsyncAPI 2/3 channels with their operations (publish/subscribe or send/receive) and messagesget_asyncapi_message— Get an AsyncAPI message with resolved payload and headers, or list all messageslist_grpc_services— List gRPC services in a .proto source with RPCs, request/response types and streaming modeget_proto_message— Get a protobuf message (fields, numbers, oneofs, maps) or enum from a .proto sourcediscover_api_specs— Find OpenAPI/Swagger, AsyncAPI, GraphQL and .proto files in the project; optionally register themdetect_api_frameworks— Detect API frameworks per module with confidence, evidence, candidate docs URLs and checked-in spec files
Register specs at startup with API_EXPLORER_ENDPOINTS (JSON array, e.g. [{"alias":"api","url":"http://localhost:8080/v3/api-docs"}]), at runtime with add_api_source, or let discover_api_specs find the files checked into the project.
diff_api_specs classifies changes as breaking / non-breaking / info and accepts a git ref, so an agent reviewing a PR can check the spec it changes. Local and private hosts are allowed; API_EXPLORER_ALLOW_PRIVATE_URLS=0 blocks them.
Environment variables: API_EXPLORER_ENDPOINTS, API_EXPLORER_PROJECT_ROOT, API_EXPLORER_CACHE_TTL, API_EXPLORER_TIMEOUT, API_EXPLORER_RETRY_COUNT, API_EXPLORER_MAX_SPEC_BYTES, API_EXPLORER_ALLOW_PRIVATE_URLS (descriptions and defaults in mcp-servers/api-explorer/metadata.json; the wizard prompts for them).
Log Analyzer Server
Stream-parse logs from files, directories, globs and rotated .gz files, or live from docker logs, docker compose logs, kubectl logs and journalctl. A stack trace stays one entry with its exception type, message and frames (Java, Python, Node, Go, .NET, Ruby).
Tools:
parse_logs— Parse logs into structured entries (multiline exceptions, fields, ids) with filters and paging.find_errors— Group errors by fingerprint with first/last seen, causes, timeline; new vs known against a baseline.analyze_patterns— Detect known problem patterns (timeouts, pools, OOM, disk, crashes) with severity and suggestions.aggregate_stats— Aggregate counts by level, logger and time bucket, error rate, peak and quiet periods.correlate_events— Chain events across files/services by request, trace, span, session, user or custom id.tail_logs— Last N entries of a log, read from the end of the file; filter by level or regex.search_logs— Grep across files, directories, globs, .gz and live sources with context lines.compare_logs— Compare two logs (e.g. before/after deploy) by level, pattern, time, error fingerprints or templates.export_report— Write an HTML, JSON or Markdown analysis report (stats, errors, patterns) to disk.watch_logs— Follow a log file (rotation-safe, multiline) with alert rules; start, status, stop or list.query_logs— Filter, group, count over time, top-k and percentiles on any field (LogQL-lite or JSON query).mine_templates— Cluster log messages into templates (Drain) with counts, levels and first/last seen.access_log_stats— HTTP access analytics: status classes, error rate over time, p50/p95/p99 per endpoint, top IPs/UAs.trace_timeline— Timeline of one trace or request id across files/services, with the span tree when logged.detect_format— Detect each source's log format and envelope with confidence and sample parsed entries.
Formats (auto-detected, with confidence): Spring Boot, Logback, Log4j2, Winston, Pino, Morgan/CLF, Python, Django, JSON lines, logfmt, zap, zerolog, logrus, Serilog, .NET console, Rails, Nginx, Apache, syslog (RFC 3164/5424), journald, Kubernetes, CRI, Docker json-file, Heroku, CloudWatch, OpenTelemetry, or a custom regex with named groups.
LOG_ALLOWED_ROOTS confines which files can be read; LOG_REDACT controls secret masking in all output.
Environment variables: LOG_EXPORT_DIR, LOG_ALLOWED_ROOTS, LOG_REDACT (descriptions and defaults in mcp-servers/log-analyzer/metadata.json; the wizard prompts for them).
Performance Profiler Server
CPU and memory profiling, benchmarks, load tests and Web Vitals for Node.js, Python, Java, Go and .NET. Profiles, flame graphs (SVG), speedscope files and heap snapshots are kept under PERF_PROFILER_OUTPUT_DIR (default .perf-profiler/).
Tools:
profile_script— CPU-profile a script (Node, Python, Java, Go, .NET): self/total time, hot paths, flame graph + speedscope files.profile_function— Time one exported function over many calls: mean/median/p95/p99, 95% CI, memory delta (Node, Python, Java).benchmark_code— Microbenchmark a script (or A/B two variants): warmup, outlier removal, CI, Welch t-test significance.analyze_memory— Track the target's heap over time, diff snapshots/histograms and give a leak verdict (Node, Python, Java, .NET).measure_startup— Measure time-to-ready over several runs (port open, log line or HTTP 200), or time to exit if none given.find_bottlenecks— Profile a script and classify hotspots from profile evidence (GC, idle, I/O, locks, CPU) with advice.attach_profiler— CPU-profile a running process: Java (JFR), Node (--inspect), Python (py-spy), .NET (dotnet-trace).profile_endpoint— Load-test one HTTP endpoint: closed or open (rate) model, latency percentiles, histogram, thresholds.list_java_processes— List running Java processes (jps) to find the PID to attach the profiler to.import_har— Import a HAR file exported from Chrome DevTools. Creates a replayable flow from recorded HTTP requests.list_flows— List all saved flows. Returns flow names, descriptions, request counts, and base URLs.replay_flow— Replay a saved flow. Optionally attach JFR profiler during replay to identify bottlenecks.stress_test_flow— Load-test a saved flow with virtual users or a constant arrival rate; caps, thresholds, background jobs.get_job— Status, live progress and (when finished) the result of a background job.stop_job— Stop a running background job; partial results are returned when the tool supports them.list_jobs— List background jobs of this server session with their status.save_baseline— Save a recorded run (runId from any measuring tool) as a named baseline for later regression checks.list_baselines— List saved baselines with their kind, subject and headline metrics.compare_results— Compare a run against a baseline or another run: per-metric change, significance, regression verdict.audit_web_vitals— Measure a page with Lighthouse (or headless Chrome): LCP, CLS, TBT, FCP, TTI, score, top opportunities.
Runtime tools are used when installed: py-spy for Python sampling and attach, JFR/jcmd for Java, go test -cpuprofile for Go, dotnet-trace/dotnet-counters for .NET, Lighthouse (or headless Chrome) for Web Vitals.
Load tests have hard caps (PERF_PROFILER_MAX_*); long runs become background jobs (get_job, stop_job). Save a run with save_baseline and check later runs with compare_results. .perf-profiler/runs/ is gitignored in installed projects; baselines/ is meant to be committed.
Environment variables: PERF_PROFILER_ALLOW_PRIVATE_URLS, PERF_PROFILER_ALLOW_RAW_CODE, PERF_PROFILER_OUTPUT_DIR, PERF_PROFILER_MAX_VUS, PERF_PROFILER_MAX_RATE, PERF_PROFILER_MAX_DURATION_S, PERF_PROFILER_MAX_REQUESTS, PERF_PROFILER_SYNC_MAX_S, PERF_PROFILER_PYTHON, PERF_PROFILER_LIGHTHOUSE, PERF_PROFILER_CHROME (descriptions and defaults in mcp-servers/performance-profiler/metadata.json; the wizard prompts for them).
Code Quality Server
Static analysis on real syntax trees (tree-sitter) for JS/TS/TSX, Python, Go, Java, Rust and C#, plus the project's own linters and type-checkers run with its own configuration.
Tools:
analyze_complexity— Per-function cyclomatic, cognitive (Sonar), nesting, Halstead and maintainability index from tree-sitter.find_duplicates— Cross-file token clone detection, incl. renamed identifiers; every match re-verified; duplication %.check_style— Run the project's linters/formatters (ESLint, Biome, Prettier, Ruff, golangci-lint, Clippy…) once per project.check_types— Run the project's type-checkers (tsc, mypy, pyright) with its own config; normalized diagnostics or SARIF.detect_antipatterns— Code smells: god class, long/complex method, deep nesting, many params, data clumps, empty catch, duplicates…find_dead_code— Unused files, exports and dependencies (JS/TS), unused imports/definitions (Python), never-called private functions.analyze_import_graph— Resolved import graph (tsconfig paths, workspaces, Python/Go/Java/Rust): cycles, orphans, fan-in/out, boundary rules.code_metrics— Code/comment/blank lines, functions, classes, imports/exports, complexity and maintainability per file and language.analyze_coverage— Read LCOV/Cobertura/JaCoCo coverage: per-file and patch coverage, risky untested functions ranked by CRAP.quality_gate— Save a findings baseline (dry run unless confirm) or check new issues against it and thresholds: pass/fail.
check_style runs ESLint, Biome, Prettier, Ruff, Pylint, golangci-lint, Clippy, Checkstyle, PMD and dotnet format once per project, locally installed binaries first; fix: true applies their autofixes. A missing or unconfigured tool is reported as such, never as "0 issues".
Every tool accepts changedSince (a git ref) to analyse only changed files. quality_gate saves a baseline (dry run unless confirm: true) and fails only on new issues; output is available as SARIF.
Environment variables: CHECKSTYLE_JAR (descriptions and defaults in mcp-servers/code-quality/metadata.json; the wizard prompts for them).
Security Scanner Server
Dependency, secret, code, container, IaC and license scanning, SBOM generation and SARIF output, wrapping the scanners installed on the machine. A scanner that is missing, crashes or times out is reported as unavailable/failed with the reason, never as zero findings.
Tools:
scan_dependencies— SCA across ecosystems and monorepos: trivy or osv-scanner, native auditors as fallback, uncovered files listedscan_secrets— Find hardcoded secrets in the working tree and optionally git history (gitleaks, trufflehog, trivy, built-in)scan_code— SAST with Semgrep: configurable rulesets, severity filter, optional diff-only mode against a git refscan_container— Scan a container image or filesystem with Trivy for vulnerabilities, secrets and misconfigurationsscan_iac— Scan IaC (Dockerfile, Kubernetes, Helm, Terraform, CloudFormation) for misconfigurations with Trivyscan_licenses— Inventory dependency licenses and flag violations of an allow/deny policy (osv-scanner or trivy)generate_sbom— Generate a CycloneDX or SPDX SBOM for a directory or container image (trivy, syft or osv-scanner)check_tools— Report installed security tools, their versions, which scans they enable, and per-OS install hintsscan_all— Run every applicable scan; each sub-scan is reported as ok, partial, failed or skipped with the reason
External tools (auto-detected; check_tools lists what is installed and how to install the rest): trivy, osv-scanner, npm/yarn/pnpm audit, pip-audit, cargo-audit, govulncheck, gitleaks, trufflehog, semgrep, syft.
Dependency manifests are found recursively (monorepos included); every finding names the tool that produced it, and ecosystems found but not scanned are listed. Every scan accepts a severity threshold and can write SARIF 2.1.0 for GitHub code scanning.
Dashboard Bridge Server
Control the dashboard and orchestrator from Claude Code.
Tools:
dashboard_open({ page?, projectPath? })- Open dashboard in browserdashboard_status()- Check if dashboard is runningdashboard_start({ devSuiteDir? })- Start dashboard serverdashboard_get_config({ projectPath })- Read dev-suite configurationdashboard_list_agents()- List available agentsdashboard_detect_stack({ projectPath })- Detect project stackget_orchestrator_task({ claim? })- Poll for orchestrator tasks from GUIreport_orchestrator_status({ jobId, status, message?, currentAgent?, recap?, summary? })- Report task progresslist_pending_jobs()- List pending orchestrator jobs
Use case: Claude Code polls get_orchestrator_task() to receive tasks submitted via the dashboard GUI, then reports progress back.
Agents Reference
Dev-suite ships 68 agents across 15 categories. Claude Code routes
to them automatically from the generated AGENTS.md; you can also call one by name.
Skill assignments are omitted here because most agents carry dozens — see docs/AGENT-CAPABILITY-MATRIX.md for the full per-agent skill and MCP breakdown. Both files are generated from agent frontmatter.
Core
Frontend
Backend
Database
Testing
Cloud
Infrastructure
Mobile
Data & AI
Security
Quality
Game Development
Industrial Automation
Bitcoin / Lightning
Bitcoin agents are domain experts: language-specific work (Rust/TS/Python/Go/JVM/.NET/C) routes to the matching language expert through skill detection. The
bitcoin/libraries/*skills attach to that language expert when the project uses rust-bitcoin, bdk, ldk, bitcoinjs-lib, python-bitcoinlib, btcd, bitcoinj, NBitcoin or libwally.
Messaging
MCP servers are never required. An agent works without them, losing only the tools that server provides.
Commands Reference
Slash commands available in Claude Code after initialization:
Upgrading
Via Dashboard (Recommended)
The easiest way to upgrade is through the Updates tab in the dashboard:
- Open the dashboard:
./init-project.sh . - Navigate to the Updates tab
- Check the version panel — it shows the version installed in your project vs the version available from source
- Click Reinstall / Sync to re-align the project to the current source
Reinstall / Sync performs a transactional erase-and-replace: managed
components are re-installed from source and orphaned ones removed, while your
custom agents/skills, CLAUDE.md notes, and settings.json keys are preserved.
Locally modified files are previewed with an Overwrite / Keep choice, a backup
is taken, and any failure rolls back automatically. Headless equivalent:
/reinstall-dev-suite or npm run reinstall -- --project <path> --dry-run.
Manual Upgrade
# 1. Pull the latest dev-suite
cd dev-suite
git pull origin main

# 2. Rebuild all MCP servers
cd mcp-servers && npm install && npm run build

# 3. Sync installed projects (run in each project)
/path/to/dev-suite/init-project.sh /path/to/your-project
Then restart Claude Code to reload the updated MCP servers.
From v1.0.x to v1.1.x
No breaking changes. Run the manual upgrade steps above. New components (agents, skills, MCP servers) added since your installation are surfaced automatically in the dashboard Manage tab with a one-click install option.
Monorepo Support
Dev-Suite automatically detects monorepo structures:
my-project/
├── frontend/                  # React, Vue, etc.
│   └── package.json
├── backend/                   # Spring Boot, NestJS, etc.
│   └── pom.xml
└── docker-compose.yml
Detected patterns:
- Frontend:
frontend,client,web,app,*-frontend - Backend:
backend,server,api,*-backend
Detection also recognises the monorepo tool config files (pnpm-workspace.yaml, turbo.json,
nx.json, lerna.json, npm workspaces) and scans subprojects, so a repo with
frontend/package.json and backend/pom.xml gets agents and MCP servers recommended for
both stacks.
This is used to drive the wizard's recommendations; it is not persisted.
.dev-suite.json records your selection, not your layout:
{
  "version": "…",
  "installedAt": "…",
  "agents":     { "enabled": ["react-expert", "…"] },
  "mcpServers": { "enabled": ["documentation", "…"] },
  "rules":      { "enabled": ["…"] },
  "targets":    ["claude-code", "cursor"]
}
The file is regenerated from the install request on every install and Sync, so editing it
by hand does not survive. The one key the installer deliberately carries forward is
integrationValidation. To change what is installed, use the dashboard's Manage tab
or /reconfigure.
Contributing
Contributions are welcome! To add new features:
Adding a New MCP Server
- Create directory:
mcp-servers/{server-name}/ - Add
package.json,metadata.json,src/index.ts - Update
mcp-servers/package.jsonworkspaces - Build:
npm install && npm run buildfrommcp-servers/
Adding a New Agent
- Create file:
agents/{category}/{name}-expert.md - Add YAML frontmatter with skills and MCP servers
- Write agent content (role, responsibilities, examples)
Adding a New Skill
- Create directory:
skills/{category}/{technology}/ - Add
SKILL.mdwith skill definition - Optionally add
quick-ref/guides
See CLAUDE.md for detailed development guidelines.
Troubleshooting
Dashboard doesn't launch
- Check Node.js version:
node --version(must be v20+) - Check if MCP servers are built:
ls mcp-servers/*/dist/index.js - Check if port 3456 is in use:
netstat -an | findstr 3456(Windows) orlsof -i :3456(Linux/macOS) - Try rebuilding:
cd mcp-servers && npm install && npm run build
MCP servers not detected in Claude Code
- Verify
.mcp.jsonexists in your project root and has valid JSON - Check that all paths in
.mcp.jsonare absolute - Restart Claude Code after initialization
- Check that MCP server dist files exist:
ls .mcp-servers/*/dist/index.js
Agent not routing correctly
- Verify
CLAUDE.mdexists in your project root and contains agent routing rules - Check that agent
.mdfiles exist in.claude/agents/ - Verify YAML frontmatter syntax in agent files
Database MCP not connecting
- Check
DATABASE_URLenvironment variable is set correctly - Test the connection string manually:
psql $DATABASE_URL(PostgreSQL) - Ensure the database server is running
Knowledge base not fetching docs
- Check Git is installed:
git --version - Verify internet connectivity (KB repo is on GitHub)
- Try forcing a refresh: ask Claude to
fetch_docs({ technology: "react", topic: "hooks", refresh: true }) - Check cache directory permissions:
.kb-cache/
License
MIT License - see LICENSE for details.
Questions or Issues?
- 📖 Knowledge Base: github.com/claude-dev-suite/knowledge_base
- 🌐 Dashboard:
http://localhost:3456(when running) - 🔌 WebSocket:
ws://localhost:3457(orchestrator)
Built with ❤️ for Claude Code developers