
Elastic Security MCP
This project implements the Model Context Protocol (MCP) to provide a bridge between Large Language Models and Elasticsearch security data.
It consists of two main components:
- Elastic MCP Server: A standalone server that exposes Elasticsearch tools via the MCP protocol.
- Elastic CLI: A feature-rich client (TUI and Web UI) that uses the MCP server to provide an AI-powered security analyst experience.
For a detailed look at how these components interact, see ARCHITECTURE.md.
Key Features
- Security-aware search tools: Structured, snippets-first search across network (Zeek, Suricata, Packetbeat) and endpoint (process, alerts) data, plus raw Query DSL access for advanced cases.
- Fast DNS lookups: Redis-backed reverse lookups for domains and IPs from a rolling 24-hour window, alongside full historical search via Elasticsearch.
- Bulk export: Stream large result sets to size-rolled JSONL files with scroll pagination and progress notifications.
- Kibana integration: Optional tools for detection rules, Fleet agents, spaces, and arbitrary Kibana API access.
- Agentic CLI: A TUI and Web UI client with multi-provider LLM support (OpenAI, Anthropic, Gemini), conversation memory, and Markdown-rendered investigation reports.
- Performance-conscious defaults: Response caching, capped response sizes, and opt-in exact-count aggregation to keep large clusters responsive.
Key Libraries
This project leverages several powerful libraries:
- Elasticsearch Go Client: The official Go client for Elasticsearch (v9).
- Model Context Protocol (MCP) SDK: SDK for building MCP servers and clients.
- goai: A Go library for integrating with multiple LLM providers (OpenAI, Anthropic, Gemini) with a unified interface and built-in agentic tool-calling loop support.
- Bubble Tea: A powerful TUI framework for Go.
- Lip Gloss: Style and layout primitives for the terminal.
- Cobra: A library for creating powerful modern CLI applications.
- Glamour: Markdown rendering for the terminal.
- Redis Go Client: Type-safe Redis client for Go.
see PKG.md for detailed list.
MCP Server Tools
The MCP server provides the following tools to any compatible host:
Elasticsearch Tools
- list_indices: List available Elasticsearch indices with doc counts, store size, and health. Supports optional pattern filtering (e.g.
logs-zeek.*). Results are cached for up to 1 hour. - cluster_health: Return Elasticsearch cluster health status (green/yellow/red), node counts, shard counts, and unassigned shards. Accepts an optional
levelparameter (cluster,indices, orshards) for more detail. - search_security_events: Structured, snippets-first search for ECS-style network and endpoint event data (Zeek, Suricata, Packetbeat, Elastic Agent). Supports typed filters (
text,start,end,ip,src_ip,dst_ip,mac,domain,url,dataset) with boosted network fields and highlighting. At least one filter is required. - export_security_events: Export large volumes of security events to JSONL files with automatic size-based file rolling, scroll-based pagination, and MCP progress notifications. Uses the same filters as
search_security_events. - search_security_alerts: Search Elastic Security detection alerts in
.alerts-security.alerts-*indices, filtering by query, severity, rule name, host, and time range. Projects key process execution details. - search_processes: Search endpoint process events (
logs-endpoint.events.process-*) with flexible filtering by executable, command line, process/parent name, user, PID, SHA256 hash, host, and time range. Exact total counting is disabled by default for performance (hits.total.relationmay begte); passinclude_total: truefor an exact count. - lookup_domain: Fast reverse lookup of DNS activity for a domain, from a rolling 24-hour Redis index of Zeek DNS logs. Returns recent queries, source IPs, and resolved addresses. For full historical queries, use
search_security_events. - lookup_ip: Fast reverse lookup of DNS activity (answers and queries) for an IP address, from a rolling 24-hour Redis index of Zeek DNS logs. For full historical queries, use
search_security_events. - search_elastic: Raw Elasticsearch Query DSL access for advanced or unsupported queries. Prefer
search_security_eventsfor common filters; use this only when raw DSL control is required. Aggregation-only (size: 0) queries defaulttrack_total_hitstofalseunless set explicitly; prefer exact term filters and avoid leading wildcards for best performance.
Kibana Tools (optional — requires KIBANA_URL)
- kibana_api_request: Execute an arbitrary HTTP request (GET, POST, PUT, DELETE, PATCH) against any Kibana REST API endpoint.
- list_kibana_spaces: List all available spaces in a Kibana instance.
- list_detection_rules: Retrieve a paginated list of detection rules from the Elastic Security app.
- get_detection_rule: Get details of a specific detection rule by its internal
idor user-definedrule_id. - list_agents: Retrieve Elastic Agents from Fleet using the Kibana Fleet API, with optional KQL filtering and pagination.
Screenshots
TUI (Terminal User Interface)
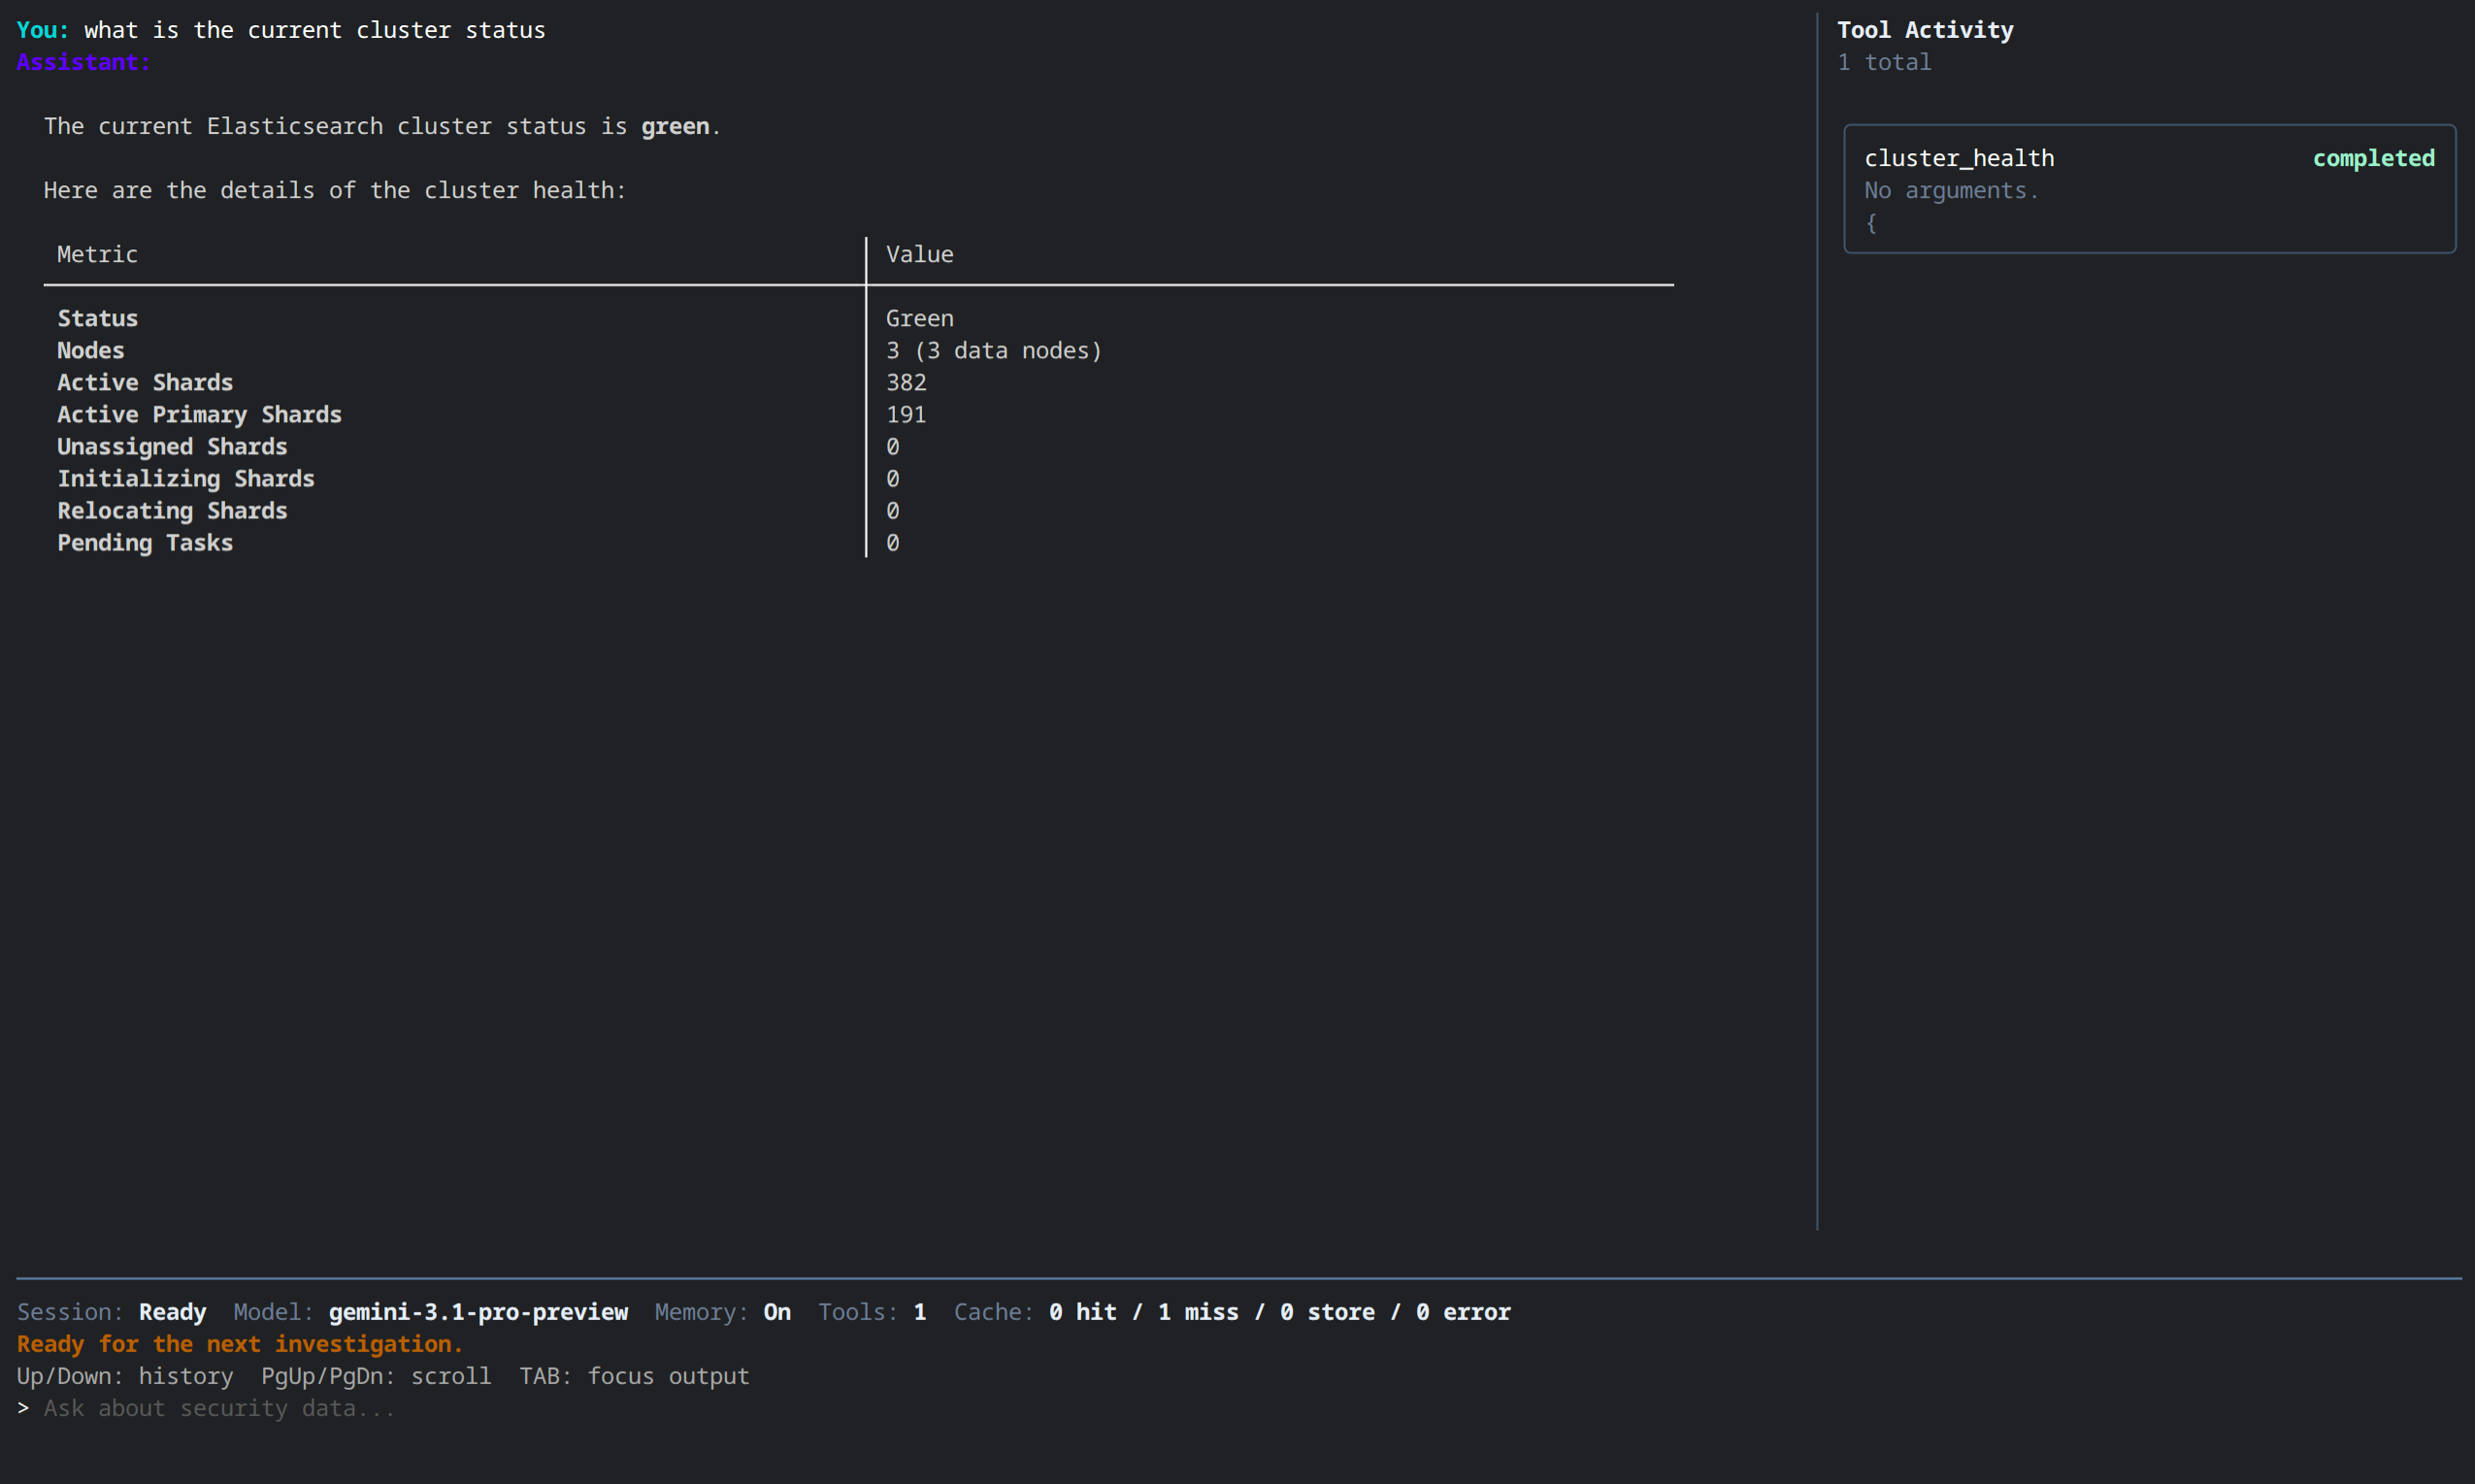
The project includes a powerful, agentic CLI that acts as a security analyst assistant.
- Interactive TUI: Built with Bubble Tea and Lip Gloss for a modern terminal experience.
- Multi-Provider Support: Seamlessly switch between OpenAI, Anthropic, and Google Gemini models.
- Interactive Model Selection: Pick your preferred provider and model on startup if not pre-configured.
- Conversation Memory: Built-in context management for long-running investigations (type
/memoryto view). - One-Shot Execution: Run quick queries and exit using the
--promptor-pflag. - Markdown Rendering: High-quality rendering of tables and analysis results using Glamour.
- Optional Web UI: Use the
--webuiflag to start a local web server with a similar look and feel to the terminal experience.
CLI Flags
Web UI (Browser Interface)
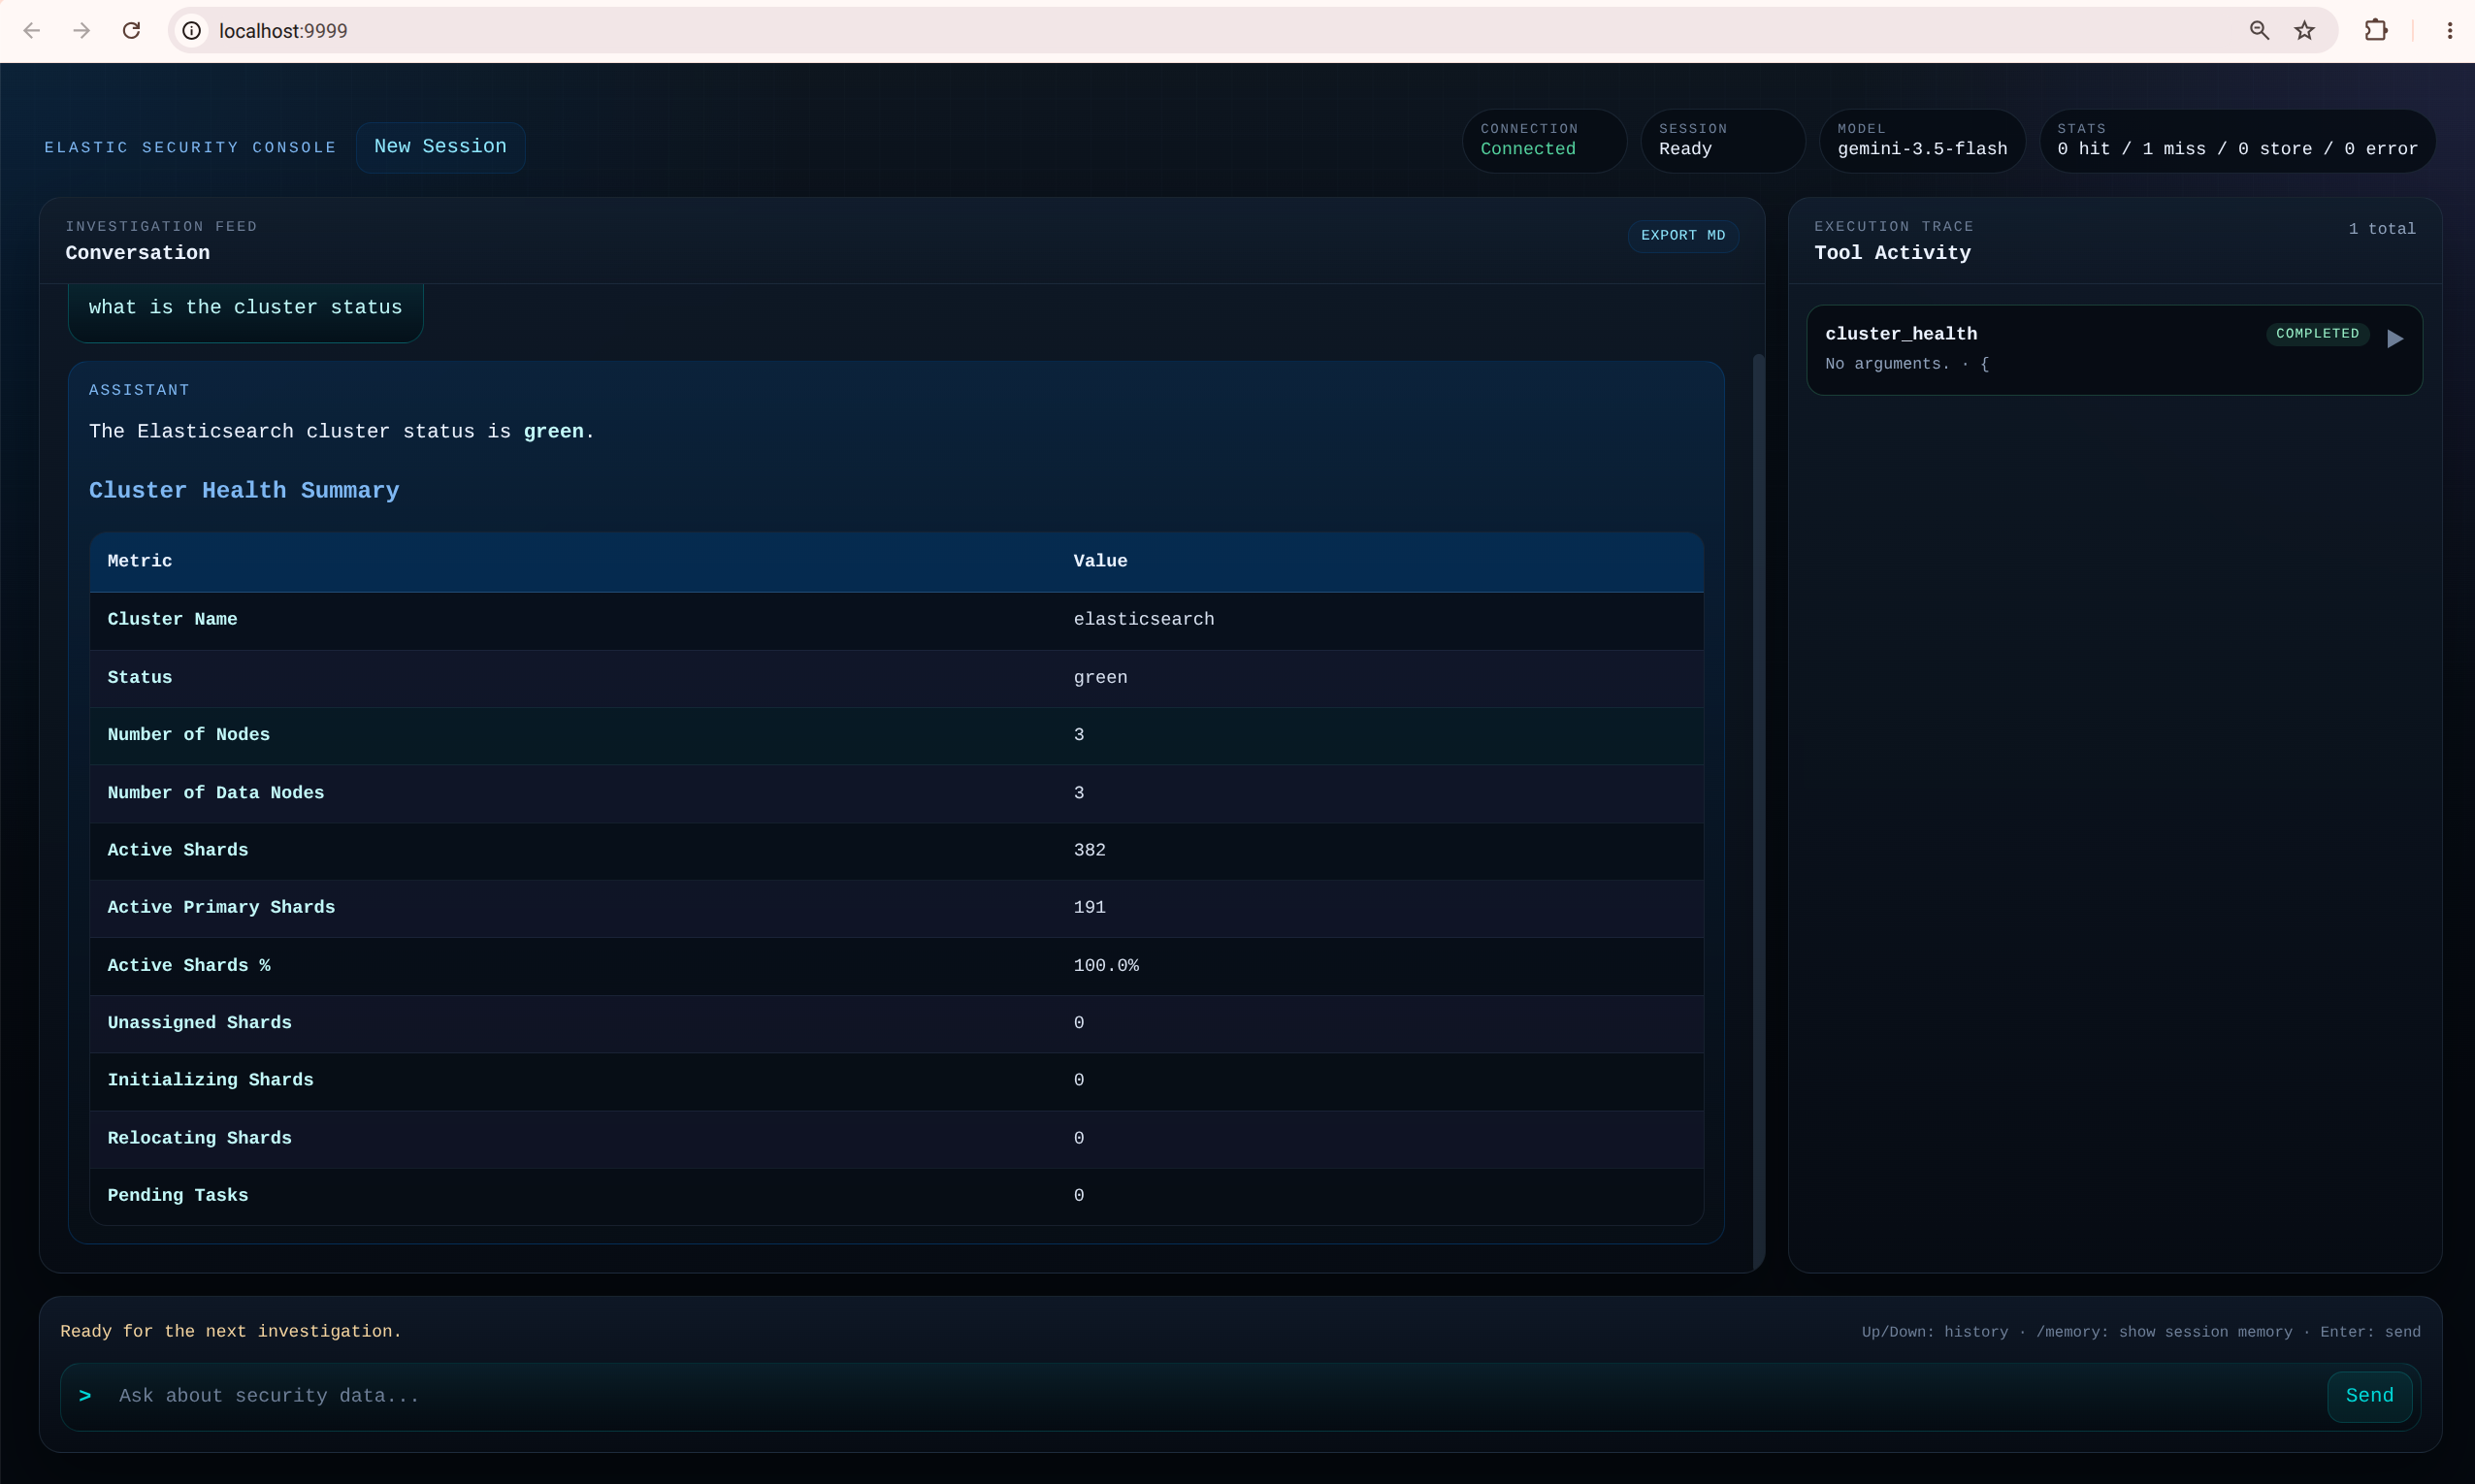
If you prefer a browser-based interface that maintains the same "security terminal" aesthetic:
./elastic-cli --webui --port 8080
Open http://localhost:8080 in your browser to start.
The Web UI provides a specialized workspace for security investigations:
- Interactive Security Console: A modern, responsive interface designed for deep-dive security analysis.
- Dual-Panel Workspace:
- Investigation Feed: A real-time conversation stream with the AI analyst. Includes full Markdown support for high-quality reports, data tables, and formatted analysis.
- Execution Trace (Tool Activity): A dedicated sidebar that provides visibility into the agent's thought process. Monitor tool calls as they happen, with expandable cards showing input arguments and raw output results.
- Real-time Feedback: Powered by WebSockets to provide immediate updates on tool progress ("Analyzing request", "Running search_security_events", etc.) and streaming responses.
- Command History: Efficiently navigate previous queries using
Up/Downarrow keys, with history persisted across browser sessions. - Session Management: Quickly clear context and start fresh investigations with a single click.
- Export to Markdown: Save your entire investigation, including both your queries and the AI's analysis, as a formatted Markdown file for easy documentation or reporting.
- Agentic Intelligence: The same powerful security analyst from the CLI, tuned to prefer structured tools like
search_security_eventsfor accurate data retrieval.
Prerequisites
- Go 1.26.2 or higher
- Access to an Elasticsearch cluster (URL and API Key)
- Redis server for caching and lookup tools:
- Default:
localhost:6379 - Recommended: Run via Podman (see below)
- Default:
- At least one LLM API key for the CLI:
OPENAI_API_KEYANTHROPIC_API_KEYGEMINI_API_KEY
Infrastructure Setup
To start the required Redis instance using Podman:
make redis-up
This uses podman compose to start an alpine-based Redis container with persistence enabled. You can monitor logs with make redis-logs or access the CLI with make redis-shell.
Installation
make all
This will build both elastic-mcp-server and elastic-cli.
Configuration
The server and CLI require the following environment variables:
ELASTIC_URL: The full URL of your Elasticsearch cluster.ELASTIC_KEY: A valid API Key for authentication.
The CLI also requires one of the following, depending on the model you choose:
OPENAI_API_KEYANTHROPIC_API_KEYGEMINI_API_KEY
Optional variables:
KIBANA_URL: The URL of your Kibana instance (e.g.http://localhost:5601). Required to enable the Kibana tools.KIBANA_USER: Optional. The username for Basic Auth (defaults toelastic).KIBANA_PASS: Optional. The password for Basic Auth.KIBANA_KEY: Optional. A Kibana API Key for authentication.KIBANA_SPACE: Optional. The Kibana Space ID (e.g.defaultormarketing) to query.ELASTIC_MODEL: Default CLI model ID if you do not pass--model.ELASTIC_MCP_SERVER: Path to the MCP server binary for the CLI and smoke-test client.CLIENT_LOG_FILE: Log file path for the CLI. Default iselastic-cli.log.CLIENT_LOG_LEVEL:debug,info,warn, orerrorfor the CLI. Default isinfo.CLIENT_LOG_PAYLOADS: Set totrueto log full CLI LLM request/response payloads. Default is off.CLIENT_HISTORY_FILE: Path to the CLI command history file. Default is~/.elastic-cli-history.SERVER_LOG_FILE: Log file path for the MCP server. Default iselastic-mcp-server.log.SERVER_LOG_LEVEL:debug,info,warn, orerrorfor the MCP server. Default isinfo.SERVER_LOCK_FILE: Path to the server PID lock file. Default iselastic-mcp-server.lock.CACHE_ENABLED: Set tofalseto disable Redis caching. Default istrue.REDIS_ADDR: Address of the Redis server. Default islocalhost:6379.CACHE_SEARCH_SECURITY_EVENTS_TTL: Cache TTL in seconds forsearch_security_events. Default is600.CACHE_SEARCH_ELASTIC_TTL: Cache TTL in seconds forsearch_elastic. Default is600.CACHE_LIST_INDICES_TTL: Cache TTL in seconds forlist_indices. Default is3600.MAX_RESPONSE_CHARS: Maximum JSON response size returned by search tools before truncation. Default is20000.TOOL_TIMEOUT_SECS: Per-tool execution timeout in seconds. Default is30.EXPORT_TIMEOUT_SECS: Overall timeout in seconds for theexport_security_eventstool. Default is1800(30 minutes).EXPORT_BATCH_TIMEOUT_SECS: Per-scroll-batch timeout in seconds during exports. Default is180.
Usage
Running the CLI (Recommended)
The CLI provides an agentic experience to interact with your security data.
export ELASTIC_URL="your_url"
export ELASTIC_KEY="your_api_key"
export OPENAI_API_KEY="your_openai_key"
./elastic-cli
You can also pick a model explicitly:
./elastic-cli --model gpt-5
Run a single query non-interactively and exit:
./elastic-cli --prompt "Show me the top 10 DNS queries in the last hour"
The CLI is tuned to prefer search_security_events for typical investigations and only fall back to search_elastic when raw DSL control is required.
Running the server standalone
The server communicates over Standard Input/Output (stdio) and can be used with any MCP host. It enforces a single-instance lock (via elastic-mcp-server.lock) to prevent duplicate server processes.
./elastic-mcp-server
Integrating with external MCP Clients (Claude Code, Gemini CLI)
A template configuration is available in .mcp.json. You can copy or reference this file to configure external MCP hosts (like Claude Desktop or Cursor).
For example, to configure the server in Claude Desktop, edit ~/.config/Claude/claude_desktop_config.json (macOS) or %APPDATA%\Claude\claude_desktop_config.json (Windows) and include the server definition from .mcp.json:
{
  "mcpServers": {
    "elastic-security-mcp": {
      "command": "elastic-mcp-server",
      "args": [],
      "env": {
        "SERVER_LOG_LEVEL": "debug",
        "ELASTIC_URL": "${ELASTIC_URL}",
        "ELASTIC_KEY": "${ELASTIC_KEY}",
        "KIBANA_URL":  "${KIBANA_URL}",
        "KIBANA_USER": "mcp",
        "KIBANA_PASS": "${KIBANA_PASS}"      }
    }
  }
}
OpenCode
{
  "$schema": "https://opencode.ai/config.json",
  "mcp": {
    "elastic-security-mcp": {
      "type": "local",
      "command": [
        "elastic-mcp-server"
      ],
      "environment": {
        "SERVER_LOG_LEVEL": "debug",
        "ELASTIC_URL": "{env:ELASTIC_URL}",
        "ELASTIC_KEY": "{env:ELASTIC_KEY}",
        "KIBANA_URL": "{env:KIBANA_URL}",
        "KIBANA_USER": "mcp",
        "KIBANA_PASS": "{env:KIBANA_PASS}"
      }
    }
  }
}
Codex (in repo/.codex/config.toml)
[mcp_servers.elastic-security-mcp]
command = "/home/mdfranz/github/elastic-security-mcp/elastic-mcp-server"
args = []

env_vars = [
  "ELASTIC_URL",
  "ELASTIC_KEY",
  "KIBANA_URL",
  "KIBANA_PASS",
]

[mcp_servers.elastic-security-mcp.env]
# Static values can remain here.
SERVER_LOG_LEVEL = "debug"
KIBANA_USER = "mcp"
Python Test Client (pydantic-ai)
A standalone Python test client is available in tools/pydantic_ai_test_mcp.py. It launches elastic-mcp-server as an MCP subprocess via pydantic-ai, then runs it through three fixed investigation tasks (cluster/index discovery, IP enrichment, and alert-to-process pivoting) while tracking token usage per task.
It's managed with uv and has no dependency on the Go toolchain beyond the built elastic-mcp-server binary.
make build   # produces ./elastic-mcp-server, which the test client launches

export ELASTIC_URL="your_url"
export ELASTIC_KEY="your_api_key"
export KIBANA_URL="your_kibana_url"       # optional, enables Kibana tool tasks
export ANTHROPIC_API_KEY="your_key"       # or OPENAI_API_KEY / GOOGLE_API_KEY

uv run tools/pydantic_ai_test_mcp.py
Pass a model ID as the first argument to use a different provider or model (defaults to claude-haiku-4-5):
uv run tools/pydantic_ai_test_mcp.py gemini-2.5-flash
uv run tools/pydantic_ai_test_mcp.py gpt-5
Logs (including per-task token totals) are written to pydantic_ai_test.log and echoed to the console.
Troubleshooting
The CLI and Server log to files for debugging:
elastic-cli.log: Contains CLI-side LLM interaction details and tool call logs (overridden byCLIENT_LOG_FILE).elastic-mcp-server.log: Contains MCP server-side logs and Elasticsearch interaction details (overridden bySERVER_LOG_FILE).
You can change the log file locations independently with CLIENT_LOG_FILE and SERVER_LOG_FILE.
Set CLIENT_LOG_LEVEL=debug or SERVER_LOG_LEVEL=debug for more detail in the corresponding process.
Set CLIENT_LOG_PAYLOADS=true only when you explicitly want full CLI request/response payload logging.
If the server fails to start with a "already running" error, check or remove the lock file (default: elastic-mcp-server.lock).
The server validates ELASTIC_URL and KIBANA_URL at startup and will exit immediately with a descriptive error if either is missing an http/https scheme or host, or still contains an unresolved ${...} placeholder (a common symptom of misconfigured MCP host env templating, e.g. in .mcp.json).