
🌐 agent-browser-mcp
Chrome DevTools for AI agents: debug, profile and test websites the way a developer does in DevTools, via MCP tools.
agent-browser-mcp is an MCP server that gives Claude, or any MCP client, the Chrome DevTools: a JavaScript debugger, the Elements panel, performance and memory profiling, network capture, device emulation and more. It drives the browser through the agent-browser CLI, so you describe the problem ("checkout fails", "the feed stutters") and the agent investigates it.
Made with ❤️ by Akash Aman
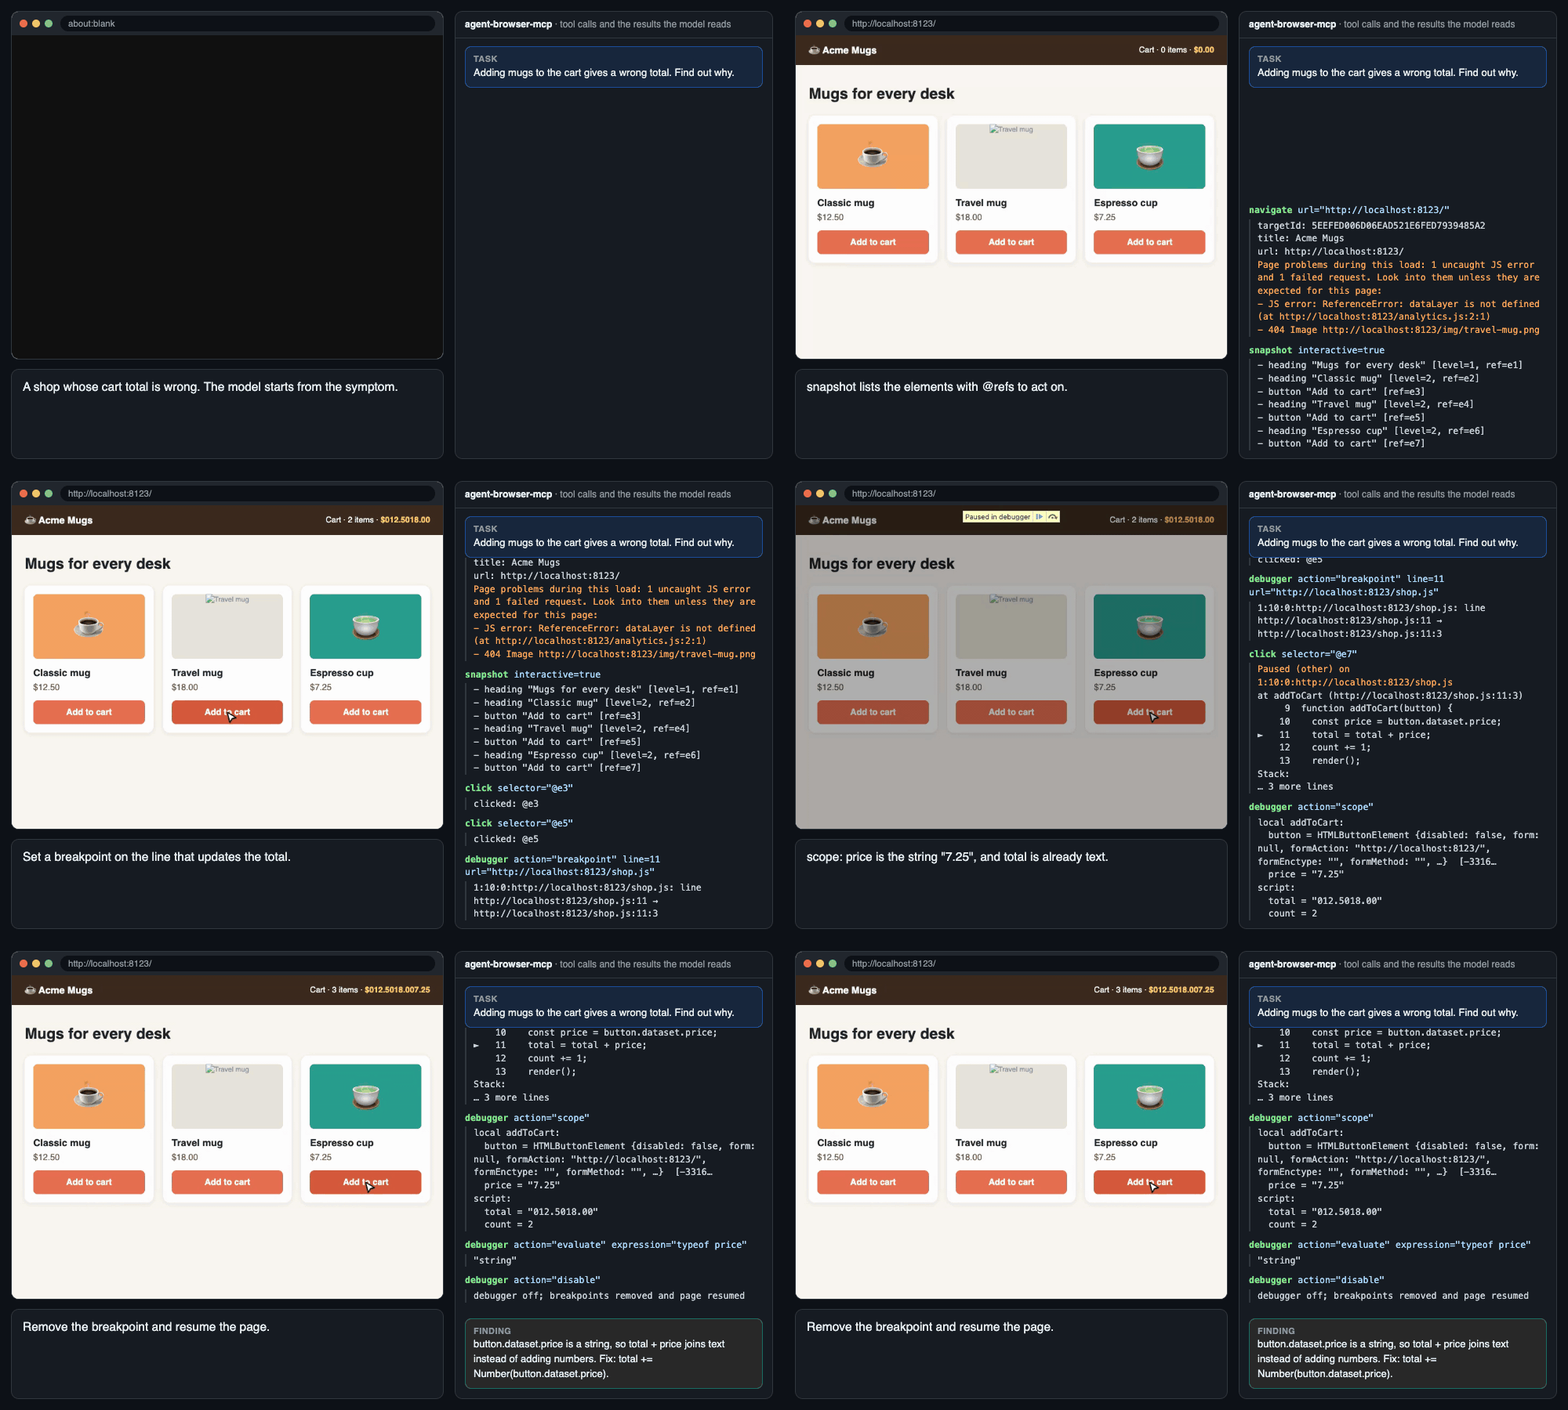
Scripted calls, real results: docs/demo drives this server over stdio against a local demo page.
✨ What it can do
- Debug from a symptom. Line, conditional, function, DOM, XHR, event and CSP breakpoints; stepping; scope and watch; async call stacks; source-mapped original files. A click that hits a breakpoint returns the paused line straight away.
- Try a fix without touching your files.
edit_sourceserves an edited script in place of the original and reloads, like DevTools Local Overrides. - Explain why something looks wrong. The CSS rules that apply and which ones lose, computed values, the box model, the accessibility name and role, and WCAG contrast. It can also force
:hover, show grid and flex overlays, and make live edits. - See the page. Screenshots of the viewport, the full page or one element, with clickable elements numbered so the model can act on what it sees.
diffcompares a screenshot with a baseline image to catch visual changes, andsave_pdfsaves the page as a PDF. - Find out why a page is slow.
- Web Vitals, rated against Google's thresholds
- a filmstrip of the load
- traces with LCP, layout-shift and render-blocking insights
- CPU profiles (self and total time), a main-thread heatmap
- JS/CSS coverage and Lighthouse
- Find jank and layout jumps. Paint flashing, layout-shift regions, the FPS meter, and running animations you can slow down or pause.
- Track down memory leaks. Heap snapshots compared by constructor, retainer paths that name the variable holding the object, and live object counts.
- Trace network problems. Each request's initiator, which cookies were sent or blocked and why, WebSocket and EventSource messages, copy as cURL or fetch, replay, mocking and blocking, and HAR files.
- Test on other devices. Phones, slow networks and CPUs, dark mode, print, locales, timezones, vision deficiencies, a disabled cache, and a virtual passkey authenticator.
- Inspect storage. IndexedDB, Cache Storage, service workers, the manifest, cookies, the back/forward cache test, and the certificate.
- Turn a session into a test. Record what the model does and export it as a Playwright test or a Puppeteer script.
- Notice problems unasked. Every page load reports its uncaught JS errors and failed requests, so the model follows up without being told.
- Reach the rest of DevTools. The
cdptool sends any DevTools Protocol command (Layers, Media, WebAudio, and more).
🎬 More demos
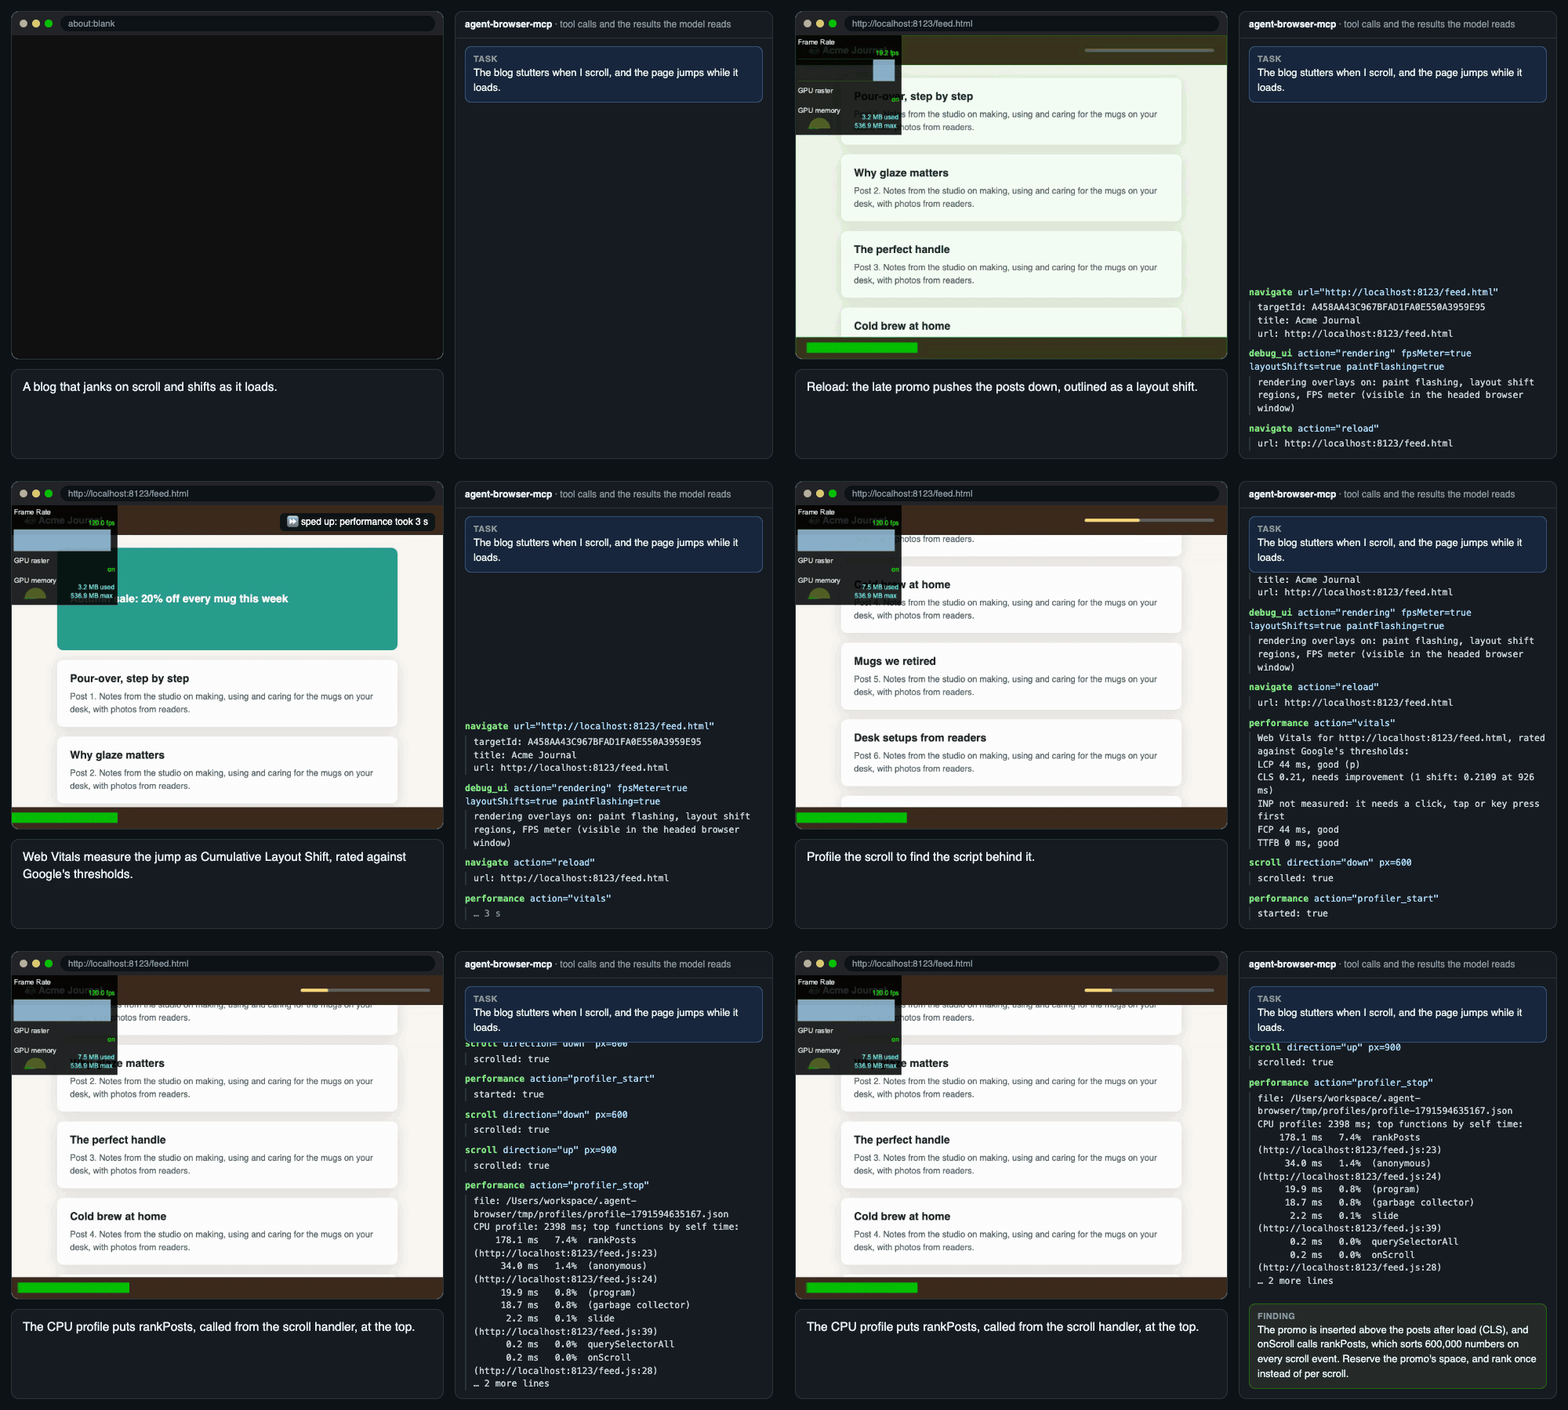
"The blog stutters when I scroll, and the page jumps while it loads." Rendering overlays outline the layout shift, Web Vitals measure it, and a CPU profile names the scroll handler.
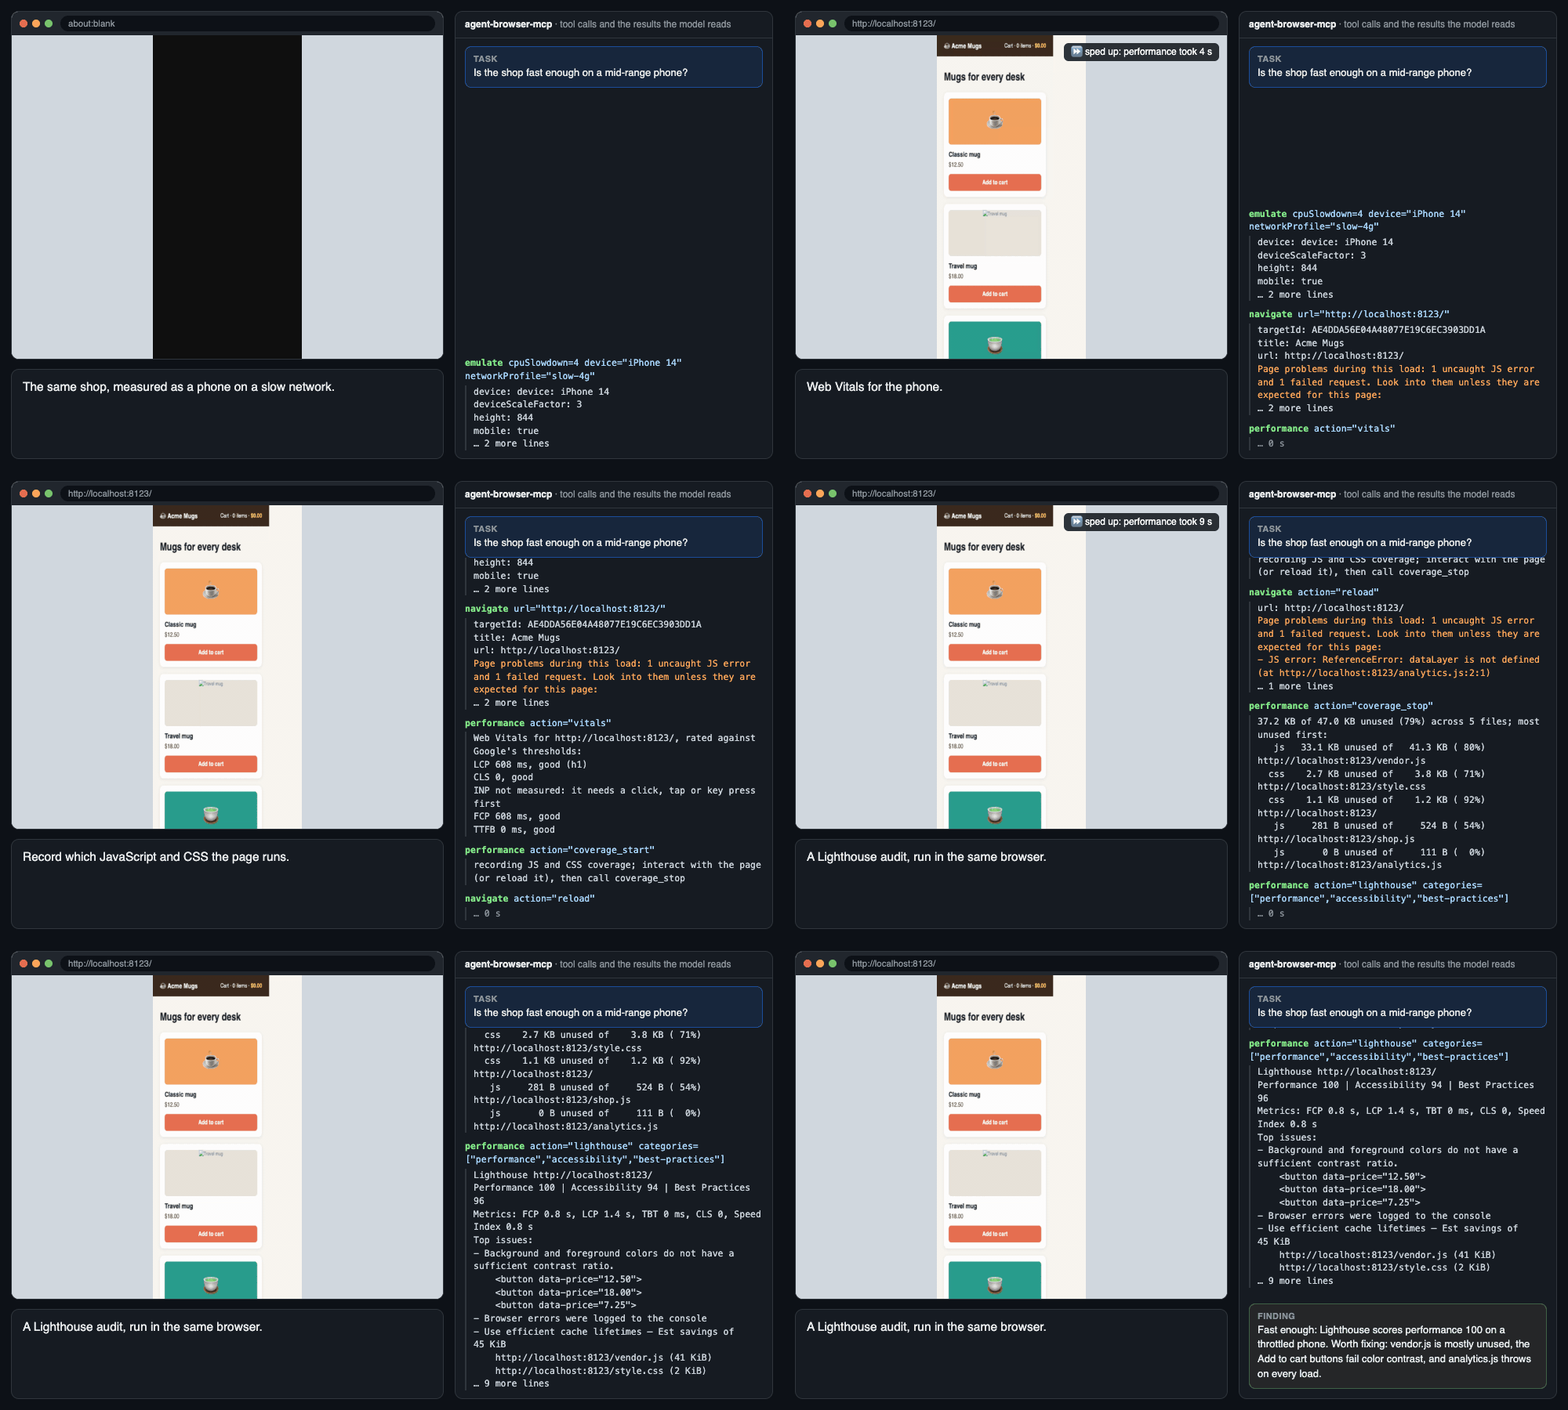
"Is the shop fast enough on a mid-range phone?" Phone emulation, Web Vitals, JS/CSS coverage and a Lighthouse audit, in the same browser.
🆚 How it differs from Claude in Chrome
Both let Claude use a browser, and they work well side by side. Claude in Chrome works in your own browser and can read the console, network requests and the page. agent-browser-mcp adds the rest of DevTools: the debugger, profilers, the Elements panel, emulation and network control.
"—" means Claude in Chrome has no tool for it in its tool list (October 2026); its JavaScript tool can script parts of these by hand. Sources: Use Claude Code with Chrome, Get started with Claude in Chrome, Claude in Chrome in Claude Desktop, and the extension's tools (/mcp → claude-in-chrome → View tools).
Use Claude in Chrome for tasks in your own browser and quick checks of a page. Use agent-browser-mcp when the website itself is the work and you need DevTools to fix it.
⚡ Why it's efficient
- Small, lazy schema. 43 tools in about 11.6k tokens. Claude Code loads a tool's schema only when it's first needed.
- Text, not pixels. An accessibility snapshot of a page costs a few hundred tokens. A screenshot is used only when you need to see the page.
- Act by reference. The model clicks
@e5from the snapshot, with no coordinates to guess and no retries when the layout shifts. - Only what changed.
snapshot:"diff"on any action returns just the lines that changed, anddeltareturns just the changed refs. - Summaries, not dumps. Traces, CPU profiles, heap snapshots and Lighthouse reports come back as a few ranked lines: the long tasks, the top functions, what grew. The full files stay on disk.
- Fewer round trips.
batchruns several known steps in one call, and a page load reports its own errors, so the model rarely has to ask. - Guided by symptom. The server's instructions map symptoms to the right tool ("slow" → vitals, "looks wrong" → styles and contrast), so the model doesn't try tools at random.
- Bounded output. Every result is capped (
--max-output), and long lists can be narrowed withpatternandlimit. - Light on your machine. The model stays in one browser, and a window left idle for 15 minutes closes itself, so forgotten browsers don't keep the CPU busy and the fans spinning.
- Exits cleanly. On reconnect the server stops at once and releases its browser connections.
🚀 Quick start
-
Install the agent-browser CLI 0.38.0 or newer and its browser:
npm install -g agent-browser@latest agent-browser install -
Download the server for your system from Releases and unpack it. On macOS, a binary downloaded with a browser is quarantined; clear it once with
xattr -d com.apple.quarantine agent-browser-mcp.Or build it (Go 1.26+):
git clone https://github.com/xcode-studio/agentbrowser-mcp.git cd agentbrowser-mcp go build -o agent-browser-mcp . -
Add it to your MCP client. For Claude Code:
claude mcp add agent-browser -- "$PWD/agent-browser-mcp" --headedFor Claude Desktop, Cursor, Cline and other clients:
{ "mcpServers": { "agent-browser": { "command": "/path/to/agent-browser-mcp", "args": ["--headed"] } } } -
Describe the problem, not the tool:
- "Checkout on localhost:3000 fails. Find out why."
- "Is this page fast enough on a mid-range phone?"
- "The feed stutters when I scroll."
--headed: shows the browser window; leave it out to run headless.- Optional: Lighthouse (
npm install -g lighthouse) for audits, and ffmpeg forrecord.
🧰 Tools
Every tool takes an optional session. Leave it out to use the current browser; a new name opens another browser.
eval_scriptruns like the DevTools Console: a script may declare the sameconstagain, promises are awaited, and DOM nodes print asdiv#app.- Click while debugging: an action that triggers a breakpoint returns the paused location. That includes a pause just after the action, such as from a
setTimeout. - Hidden elements:
click,fill,typeand hover refuse an element that isn't visible, where agent-browser would report success. - Editing shortcuts:
press_keywith Control or Meta plus a, c, x, v, z or y selects all, copies, cuts, pastes, undoes or redoes, on macOS too. - New windows:
tabs new_windowopens a window with its own cookies and storage, for testing a second user. Downloads work there too. - Recorded flows:
record flow_exportcan be called again for the other format, and the flow keeps recording. - Source maps: a breakpoint can name an original file (
src/cart.ts:12), and pauses show the authored source.
Not covered: parts that serve a person at the keyboard, or that the model does itself:
- AI assistance and Console Insights
- Workspace and Snippets
- the font and color editors
$0- remote devices
- Lighthouse's timespan and snapshot modes
⚙️ Configuration
Every setting can come from an environment variable or a flag; flags win.
Use your own logged-in Chrome. Recent Chrome refuses remote debugging on the default profile, so:
- Dedicated profile:
--profile ~/.agent-browser/chrome, then log in once with--headed. - Copy logins once:
agent-browser --auto-connect state save ~/auth.json, then start with--state ~/auth.json. - Attach:
--cdp 9222,--auto-connect, or thesessiontool'sconnectaction.
🔧 How it works
MCP client ⇄ stdio ⇄ agent-browser-mcp ─┬─ agent-browser CLI (--json) ─ Chrome
                                         └─ Chrome DevTools Protocol ───┘
- CLI path: page actions run
agent-browser <command> --json. Results are reshaped into short text, or an image for screenshots. - CDP path: the debugger, elements, performance, application, console Issues,
eval_script, the clipboard, throttling and the rendering overlays talk to Chrome directly, with one connection per session. - While paused: other tools answer "resume first" instead of hanging.
- Closed browsers: if the idle timeout closed a browser, the next call says so before it starts a fresh one.
- agent-browser gaps handled here:
- downloads in a new window
state rename- snapshot diffs that never kept a baseline
- importing a
Cookie:header - copy and paste that changed nothing
- a device's user agent that wouldn't reset
🔗 Compatibility
The server checks agent-browser --version at startup and warns if the CLI is older. help {topic:"doctor"} reports it too.
2.0 merges about 150 single-purpose tools into about 40 tools with an action, by or what parameter. For example, find_by_text_click became find {by:"text", action:"click"} and get_page_title became get {what:"title"}. The old tool names are gone.
🛠️ Development
go test ./...                                     # fake CLI and fake Chrome, a few seconds
go test -tags integration ./internal/mcp/tools/   # a real browser against local fixture pages
go build -o agent-browser-mcp . && go run docs/demo/main.go   # re-record the demo GIFs
- Fakes: unit tests run every tool against a fake agent-browser that records its arguments, and a fake Chrome that records protocol calls.
- Guards: coverage tests fail if a tool or enum value has no test case. Budget tests keep
tools/listunder 48 KB and the instructions under Claude Code's 2,048-character limit. - Lighthouse: set
LIGHTHOUSE_PATH=$(which lighthouse)to include the Lighthouse audit in the integration run. - Releases: push a tag such as
v2.0.1. GitHub Actions runs the tests, builds macOS, Linux and Windows binaries (amd64 and arm64) with GoReleaser, and publishes them with a changelog.goreleaser release --snapshot --cleanbuilds the same archives locally intodist/.
🤝 Contributing
Contributions, issues, and feature requests are welcome! Feel free to check the issues page.
📝 License
This project is MIT licensed.